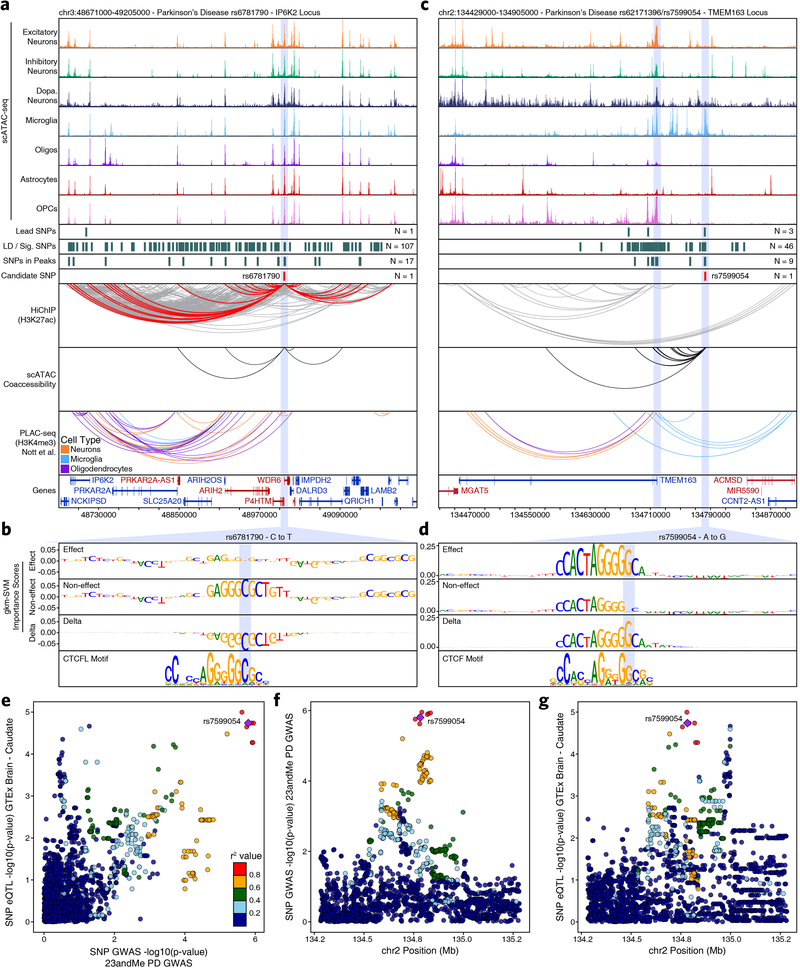
Extended Data Fig. 8. Multi-omic characterization of noncoding SNPs identifies novel genes implicated in PD.
a,c, Normalized scATAC-seq-derived pseudo-bulk tracks, H3K27ac HiChIP loop calls, co-accessibility correlations, and publically available H3K4me3 PLAC-seq loop calls (Nott. et al. 2019) in (a) the IP6K2 gene locus (chr3:48671000–49205000) or (c) the TMEM163 gene locus (chr2:134429000–134905000). scATAC-seq tracks represent the aggregate signal of all cells from the given cell type and have been normalized to the total number of reads in TSS regions, enabling direct comparison of tracks across cell types. For HiChIP, each line represents a FitHiChIP loop call connecting the points on each end. Red lines contain one anchor overlapping the SNP of interest while grey lines do not. For co-accessibility, only interactions involving the accessible chromatin region of interest are shown. For PLAC-seq, MAPS loop calls from microglia (blue), neurons (orange), and oligodendrocytes (purple) are shown. b,d, GkmExplain importance scores for each base in the 50-bp region surrounding (b) rs6781790 or (d) rs7599054 for the effect and non-effect alleles from the gkm-SVM model for (b) astrocytes (Cluster 15) or (d) microglia (Cluster 24). The predicted motif affected by the SNP is shown at the bottom and the SNP of interest is highlighted in blue. e, Dot plot comparing the –log10(p-value) from 23andMe PD GWAS data with the –log10(p-value) from GTEx Caudate eQTL data of SNPs in the TMEM163 locus. Each dot represents an individual SNP. Dot color represents the r2 value of LD with the lead SNP (rs7599054 – purple diamond) within a European reference population. f-g, Dot plots showing the genomic coordinates of each SNP and the –log10(p-value) from (f) 23andMe PD GWAS data or (g) GTEx Caudate eQTL data. Dots are colored as in Extended Data Figure 8e. In (e-g), p-values are based on genome-wide chi-squared statistics from the relevant GWAS and eQTL studies.

