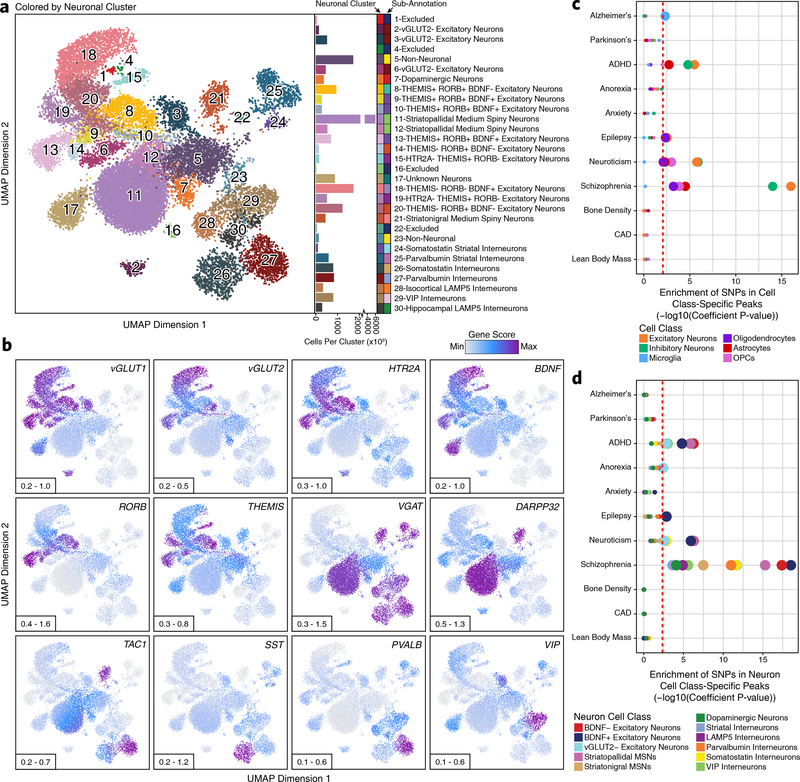
Fig. 2 – Sub-clustering identifies diverse biologically relevant neuronal cell types in the adult brain.
a, Left; UMAP dimensionality reduction after iterative LSI of scATAC-seq data from neuronal cells from 10 different samples. Each dot represents a single cell (N = 21,116). Dots are colored by their corresponding neuronal sub-cluster. Neuronal cluster numbers are overlaid on the UMAP above each neuronal cluster centroid. Right; Bar plot showing the number of cells per cluster. Each neuronal cluster sub-annotation is labeled to the right of the bar plot and indicated by color. b, The same UMAP dimensionality reduction shown in Figure 2a but each cell is colored by its gene activity score for the annotated lineage-defining gene. The minimum and maximum gene activity scores are shown in the bottom left of each panel. c-d, LD score regression identifying the enrichment of GWAS SNPs from various brain-related and non-brain-related conditions in the peak regions of various (c) cell classes from the broad scATAC-seq clustering or (d) neuronal cell classes identified from the neuronal sub-clustering analysis. The dotted line represents the Bonferroni-corrected significance threshold for the LDSC coefficient P value (see Methods), adjusted for the number of cell classes tested. The size of the point for each cell class indicates whether this cell class passes the Bonferroni-corrected significance threshold (larger) or not (smaller).

