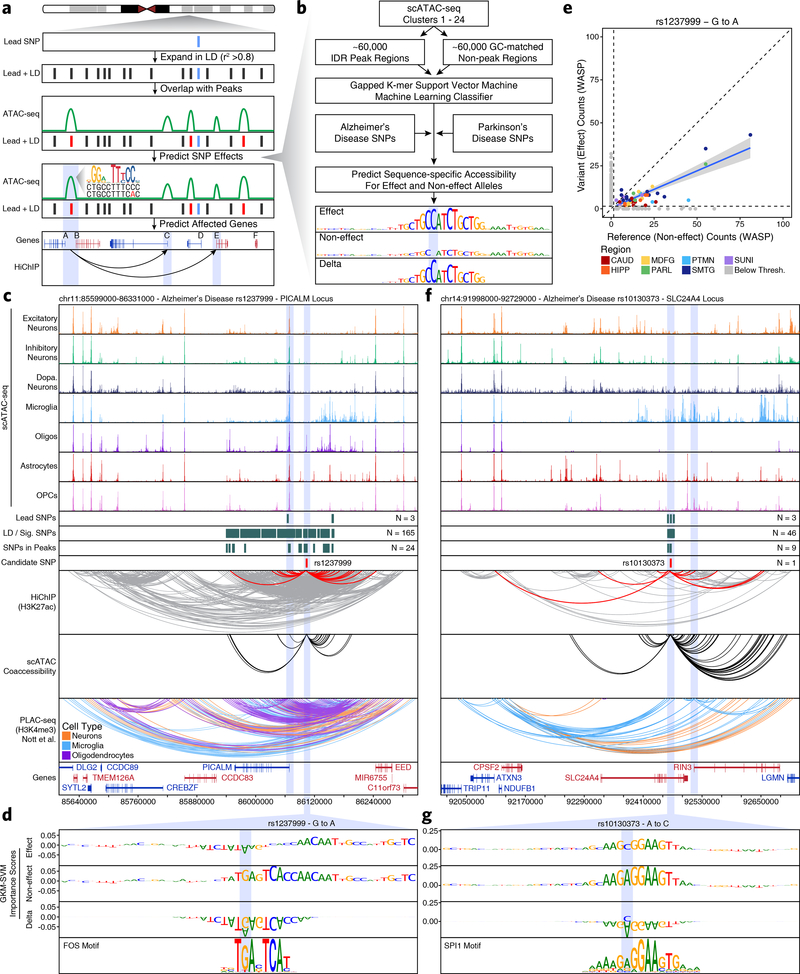
Fig. 3 – Machine learning predicts functional polymorphisms in AD and PD.
a, Schematic of the overall strategy for tiered identification of putative functional SNPs and their corresponding gene targets. b, Schematic of the gkm-SVM machine learning approach used to predict which noncoding SNPs alter TF binding and chromatin accessibility. c,f, Normalized scATAC-seq-derived pseudo-bulk tracks, H3K27ac HiChIP loop calls, co-accessibility correlations, and publicly available H3K4me3 PLAC-seq loop calls (Nott et al. 2019) in the (c) PICALM gene locus (chr11:85599000–86331000) and (f) SLC24A4 locus (chr14:91998000–92729000). scATAC-seq tracks represent the aggregate signal of all cells from the given cell type and have been normalized to the total number of reads in TSS regions. For HiChIP, each line represents a FitHiChIP loop call connecting the points on each end. Red lines contain one anchor overlapping the SNP of interest. For co-accessibility, only interactions involving the accessible chromatin region of interest are shown. For PLAC-seq, MAPS loop calls from microglia (blue), neurons (orange), and oligodendrocytes (purple) are shown. d,g, GkmExplain importance scores for each base in the 50-bp region surrounding (d) rs1237999 and (g) rs10130373 for the effect and non-effect alleles from the gkm-SVM model corresponding to (d) oligodendrocytes (Cluster 21) and (g) microglia (Cluster 24). The predicted motif affected by the SNP is shown at the bottom and the SNP of interest is highlighted in blue. e, Dot plot showing allelic imbalance at rs1237999. The bulk ATAC-seq counts for the reference/non-effect (G) allele and variant/effect (A) allele are plotted. Each dot represents an individual bulk ATAC-seq sample (N = 140) colored by brain region. Samples where fewer than 3 reads were present to support both the reference and variant allele (i.e. presumed homozygotes or samples with insufficient sequencing depth) are shown in grey. The blue line represents a linear regression of the non-grey points and the grey box represents the 95% confidence interval of that regression.

