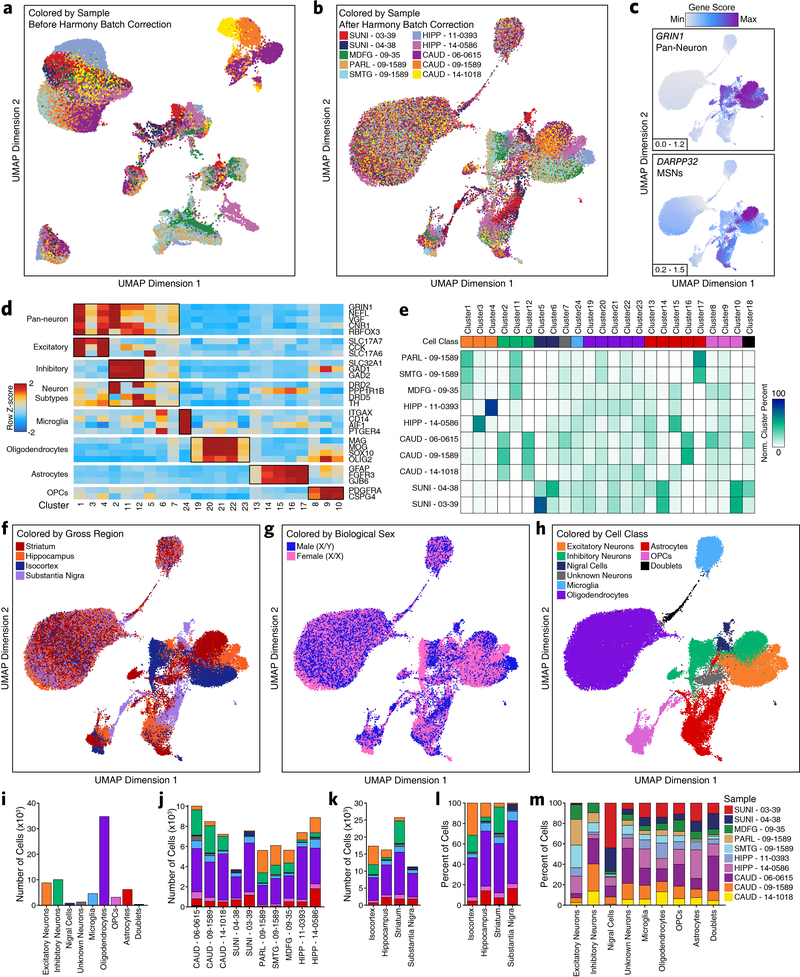
Extended Data Fig. 1. Region-centric scATAC-seq identifies cellular and regional heterogeneity in chromatin accessibility in adult brain.
a-b, UMAP dimensionality reduction (a) prior to and (b) after batch correction with Harmony of scATAC-seq data from 10 different samples. Each dot represents a single cell (N = 70,631). Dots are colored by the sample of origin. Color labels are shown in Extended Data Figure 1b. c, The same UMAP dimensionality reduction shown in Extended Data Figure 1b but each cell is colored by its gene activity score for the annotated lineage-defining gene. Gene activity scores were imputed using MAGIC. Grey represents the minimum gene activity score while purple represents the maximum gene activity score for the given gene. The minimum and maximum scores are shown in the bottom left of each panel. The gene of interest and the cell type that it identified are shown in the upper left of each panel. MSNs – medium spiny neurons. d, Heatmap of cell type-specific markers used to define the cell type corresponding to each cluster. Color represents the row-wise Z-score of chromatin accessibility in the vicinity of each gene for each cluster. e, Cluster residence heatmap showing the percent of each cluster that is composed of cells from each sample. Cell numbers were normalized across samples prior to calculating cluster residence percentages to account for differences in total pass filter cells per sample. f-h, UMAP dimensionality reduction as shown in Extended Data Figure 1b but colored by (f) the gross brain region from which each cell was obtained, (g) the biological sex of the donor for each cell, or (h) the predicted cell class for each cell. i-k, Bar plot showing the number of cells identified in our scATAC-seq data from (i) each of the annotated cell classes, (j) each of the annotated donors/samples, or (k) each of the gross brain regions subdivided based on cell class. Color represents the predicted cell class as shown in the legend of Extended Data Figure 1h. l-m, Bar plot showing the percentage of cells in our scATAC-seq data from (l) each of the gross brain regions subdivided based cell class or (m) each of the annotated cell classes subdivided based on donor/sample of origin. Color represents (l) the predicted cell class as shown in the Extended Data Figure 1h or (m) the biological sample from which the cells were obtained.

