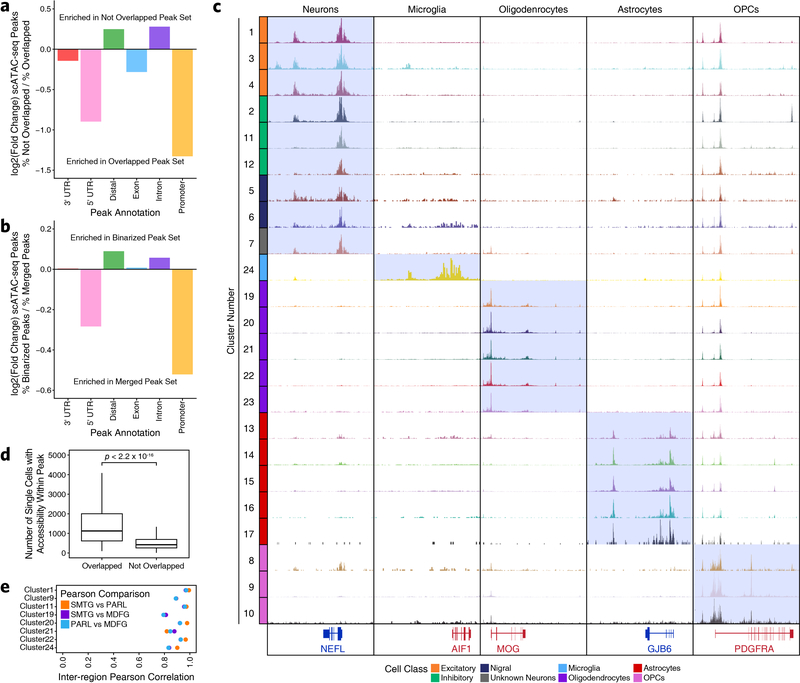
Extended Data Fig. 2. Cellular heterogeneity in brain tissue necessitates single-cell approaches to capture biological complexity.
a-b, Bar plot of the log2(Fold Change) in the percent of peaks mapping to various genomic annotations comparing peaks from (a) the scATAC-seq peak set that are not overlapped by a peak from the bulk ATAC-seq peak set to peaks that are overlapped by a peak from the bulk ATAC-seq peak set or (b) the scATAC-seq peak set that are were identified as cell type-unique through feature binarization to all peaks from the scATAC-seq peak set. c, Sequencing tracks of lineage-defining factors shown across all 24 scATAC-seq clusters (except Cluster 18 – putative doublets). From left to right, NEFL (neurons; chr8:24933431–24966791), AIF1 (aka IBA1, microglia; chr6:31607841–31617906), MOG (oligodendrocytes; chr6:29652183–29699713), GJB6 (astrocytes; chr13:20200243–20239571), and PDGFRA (OPCs; chr4:54209541–54303643). d, Box and whiskers plots showing the distribution of the number of single cells from our scATAC-seq data showing accessibility within (left) each peak from the set of peaks from the scATAC-seq peak set that overlap a peak from the bulk ATAC-seq peak set (N = 120,941 peaks) and (right) each peak from the set of peaks from the scATAC-seq peak set that do not overlap a peak from the bulk ATAC-seq peak set (N = 238,081 peaks). The lower and upper ends of the box represent the 25th and 75th percentiles and the internal line represents the median. The whiskers represent 1.5 multiplied by the inter-quartile range. P-value determined by Kolmogorov–Smirnov test. e, Dot plot showing the inter-region Pearson correlation of pseudo-bulk replicates comprised of all cells from either SMTG, PARL, or MDFG within each of the clusters shown. The clusters shown were selected based on biological relevance (i.e. clusters annotated as “substantia nigra astrocytes” should not be compared across isocortical regions) and on cluster size (i.e. clusters with small numbers of isocortical cells would not provide robust comparisons).

