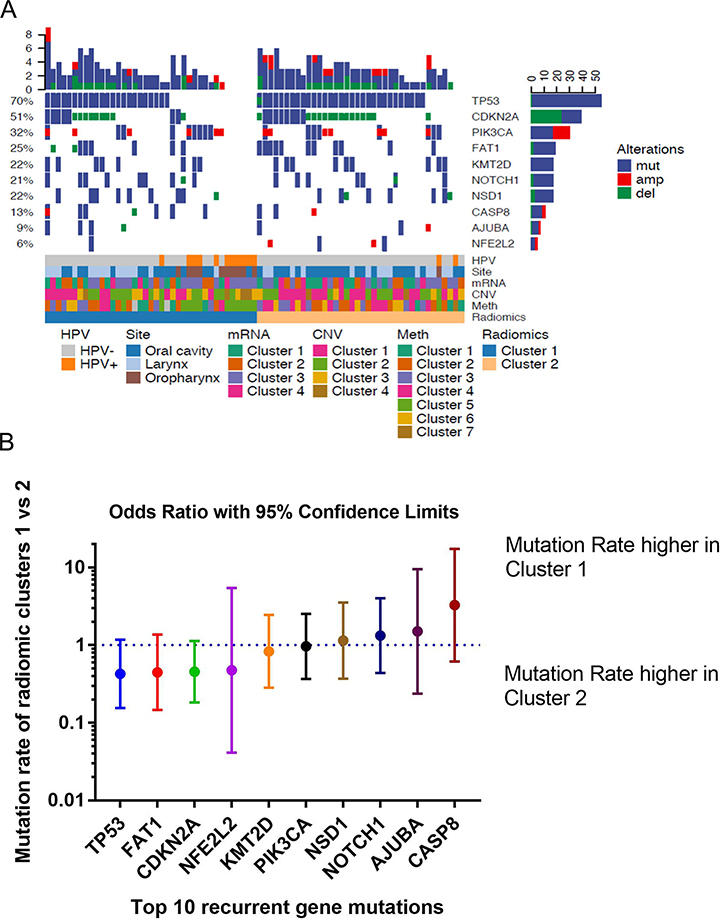
Figure 3. Radiomic clusters identify important clinical and genomic characteristics of HNSCC.
(A) Oncoprint enables visualization of multiple genomic alterations such as mutation events for each patient. Oncoprint shows the distributions of the most frequent alterations in HNSCC in radiomic clusters 1 and 2. Mutations are color coded in blue. The annotation bar reveals gene expression clustering, copy number variation (CNV) clustering, and DNA methylation clustering.
(B) Associations of the top 10 recurrently mutated genes in HNSCC with the two radiomic clusters. Odds ratios are given for recurrent gene mutations comparing cluster 1 vs cluster 2.

