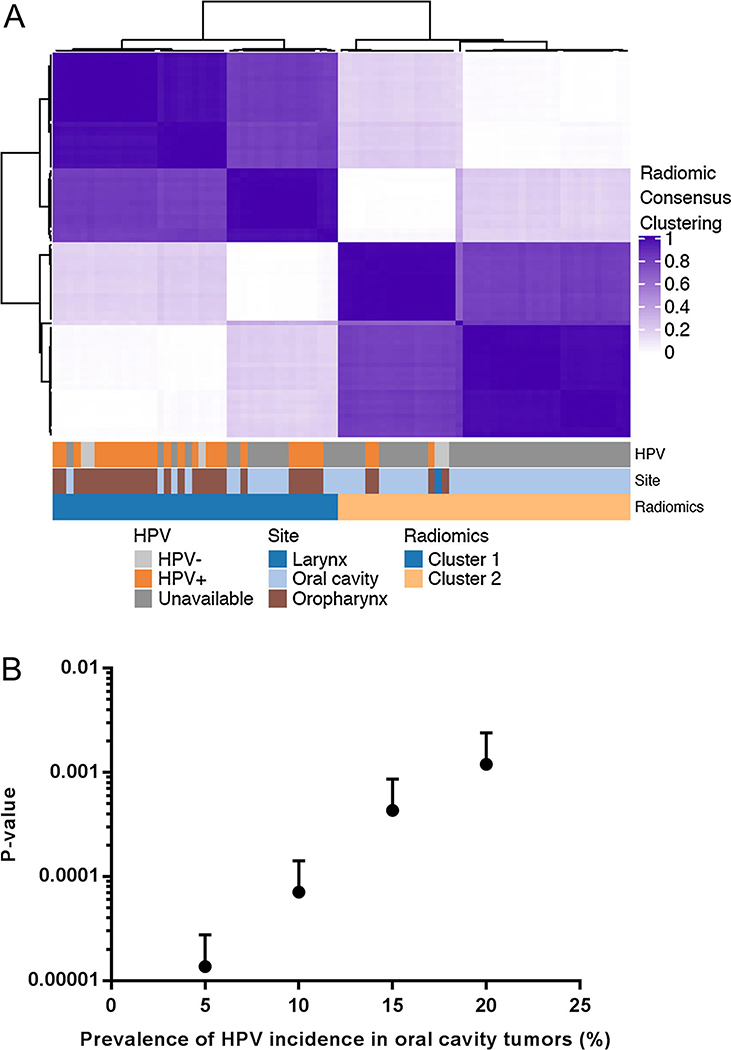
Figure 5. A validation cohort of HNSCC reveals two stable and distinct radiomic clusters.
(A) The consensus matrix of hierarchical clustering demonstrates two stable and coherent clusters. Consensus values range between 0 and 1, colored from light purple to dark purple. The annotation bar shows tumor subsite.
(B) A sensitivity analysis, using simulations assuming the HPV-positive prevalence of 5%, 10%, 15%, and 20% within the oral cavity cases in the validation cohort. P-values indicate the statistical significance of the difference in HPV status between the two radiomic clusters.

