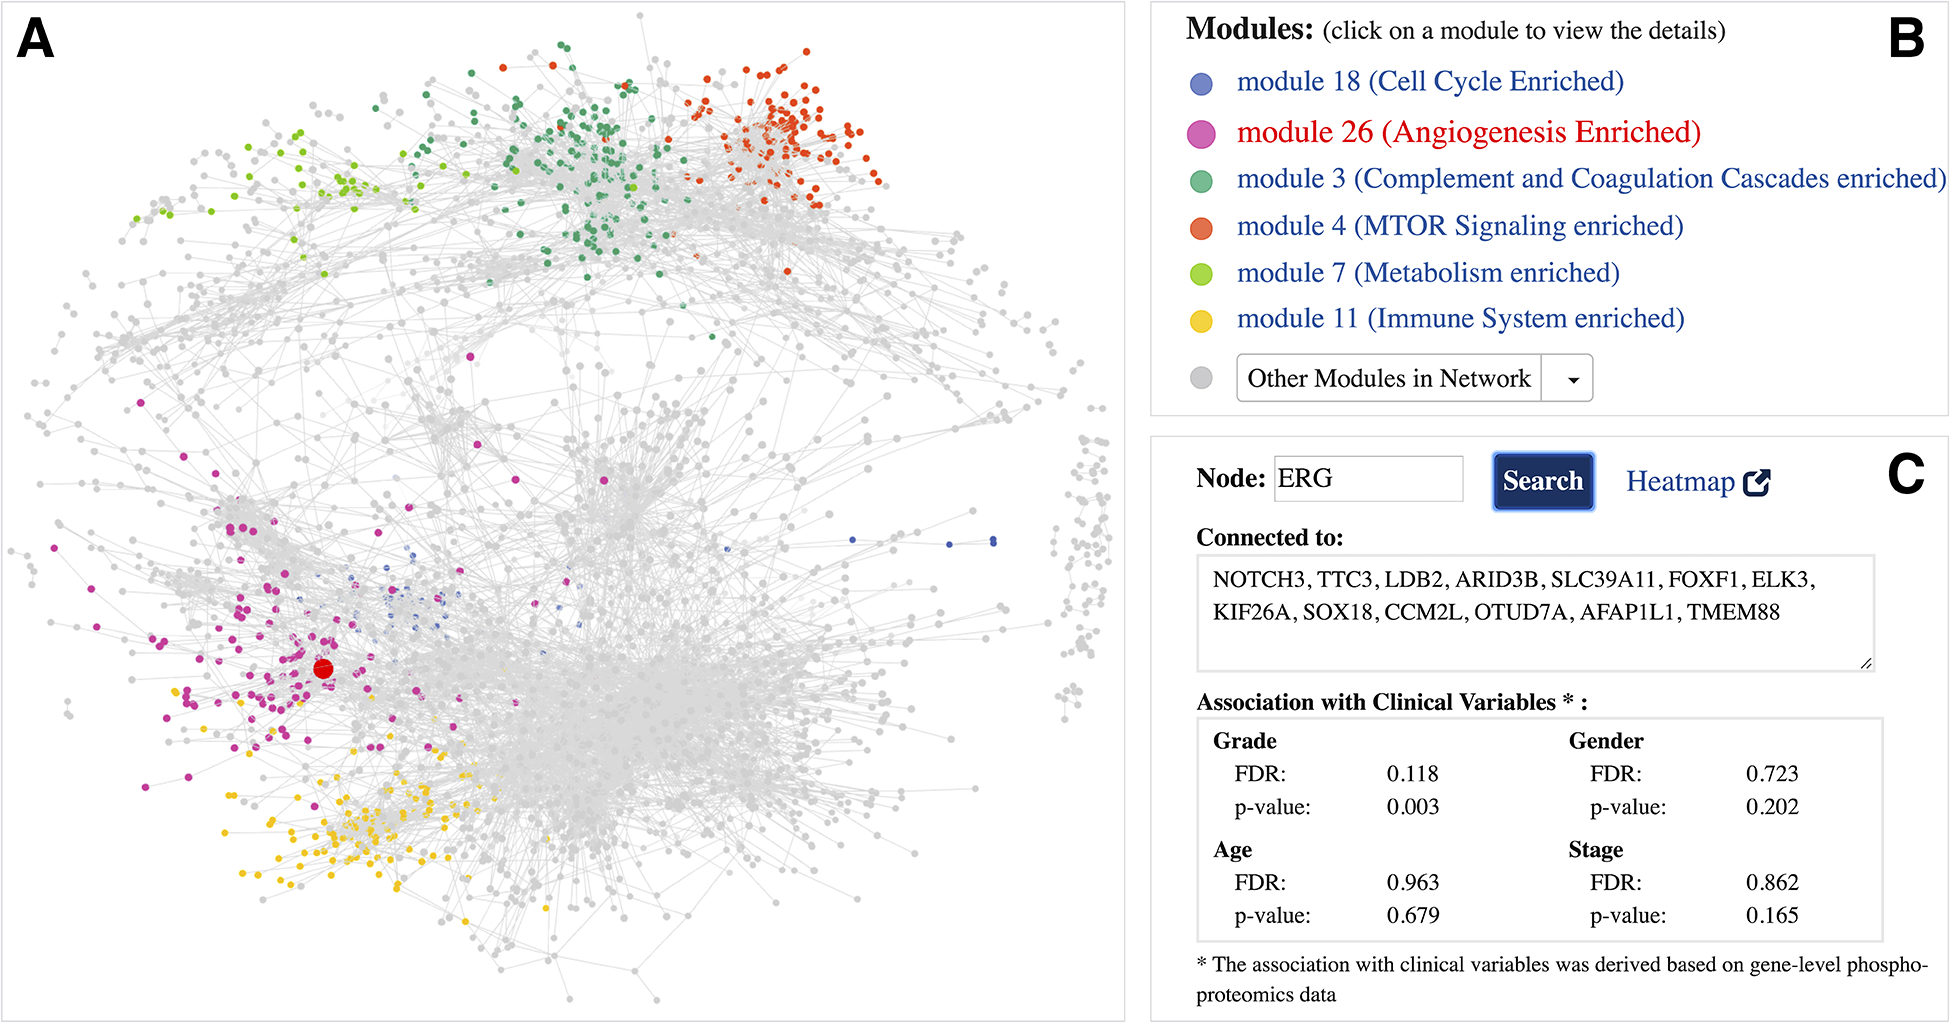
Figure 1.

Global ccRCC tumor phosphoproteomics co-expression network A interactive 3D network exploration panel. Subsets of genes are color-coded based on their association with modules that are part of significant biological pathways. Large, red-colored node highlights the ERG gene; B list of module networks. 6 modules that are part of significant biological pathways are color-coded, the remaining 24 module networks are listed under the Other Modules in Network dropdown menu; C meta-data information associated with ERG gene. Gene-specific information includes the list of connections (co-expressed genes) and its association with clinical variables.
