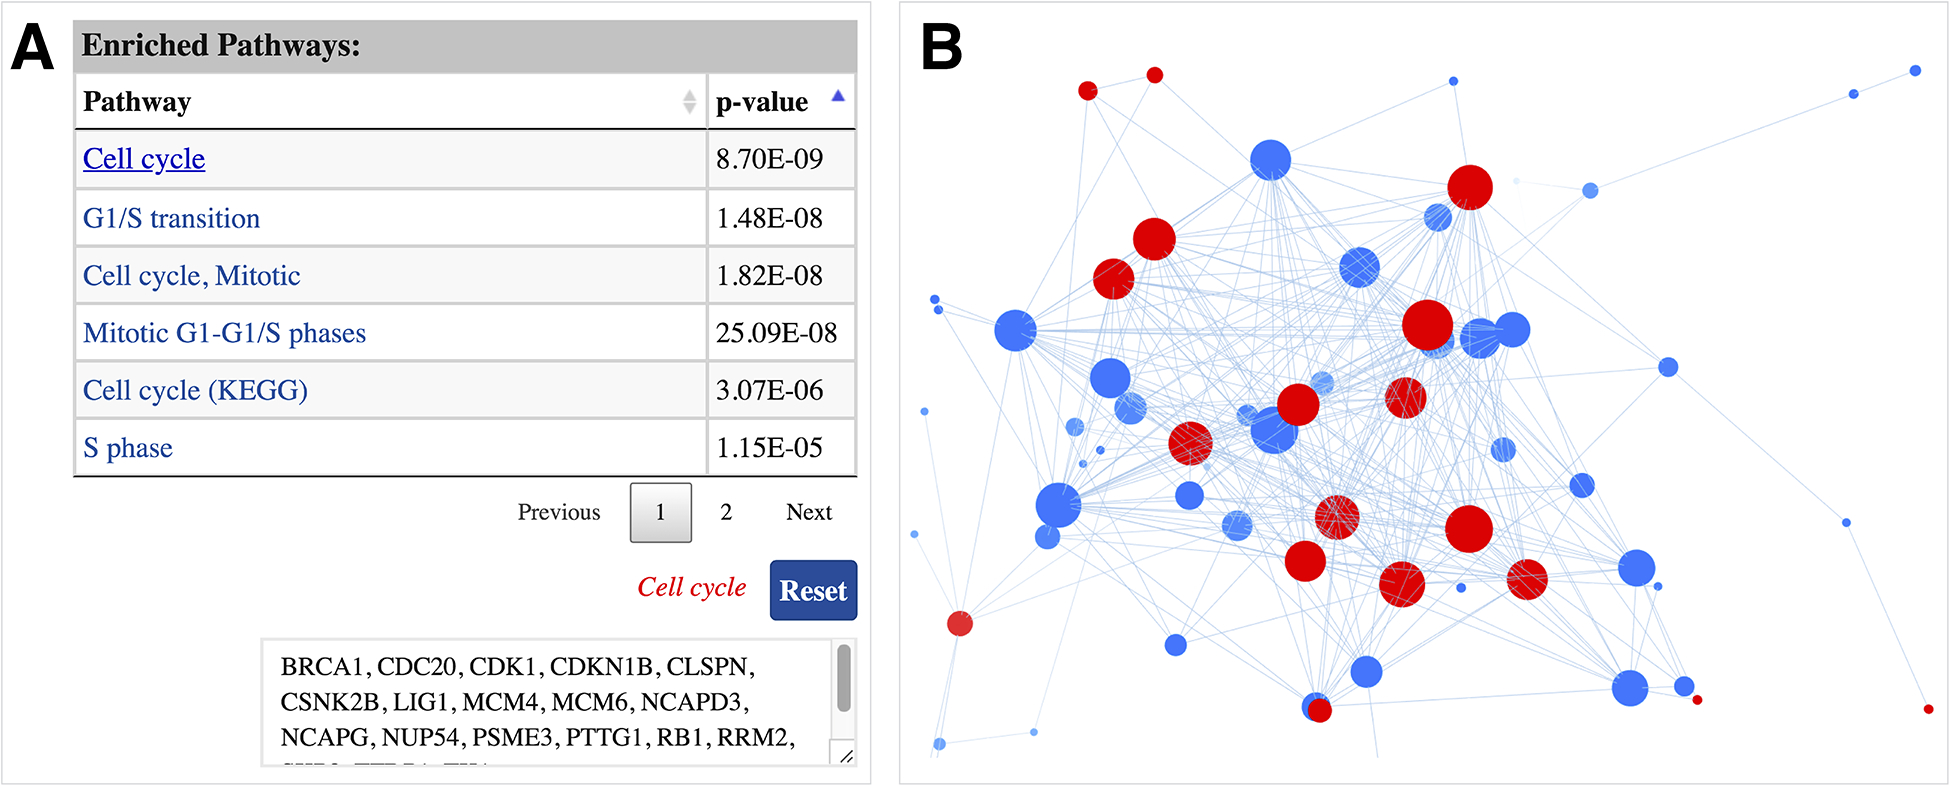
Figure 3.

Cell cycle enriched module network A interactive table displaying the list of enriched pathways, sorted by their p-values, associated with the network. List of genes associated with a pathway can be displayed by clicking on the pathway name; B genes associated with the pathway of interest are highlighted in red in the interactive network exploration panel.
