
Figure 2.
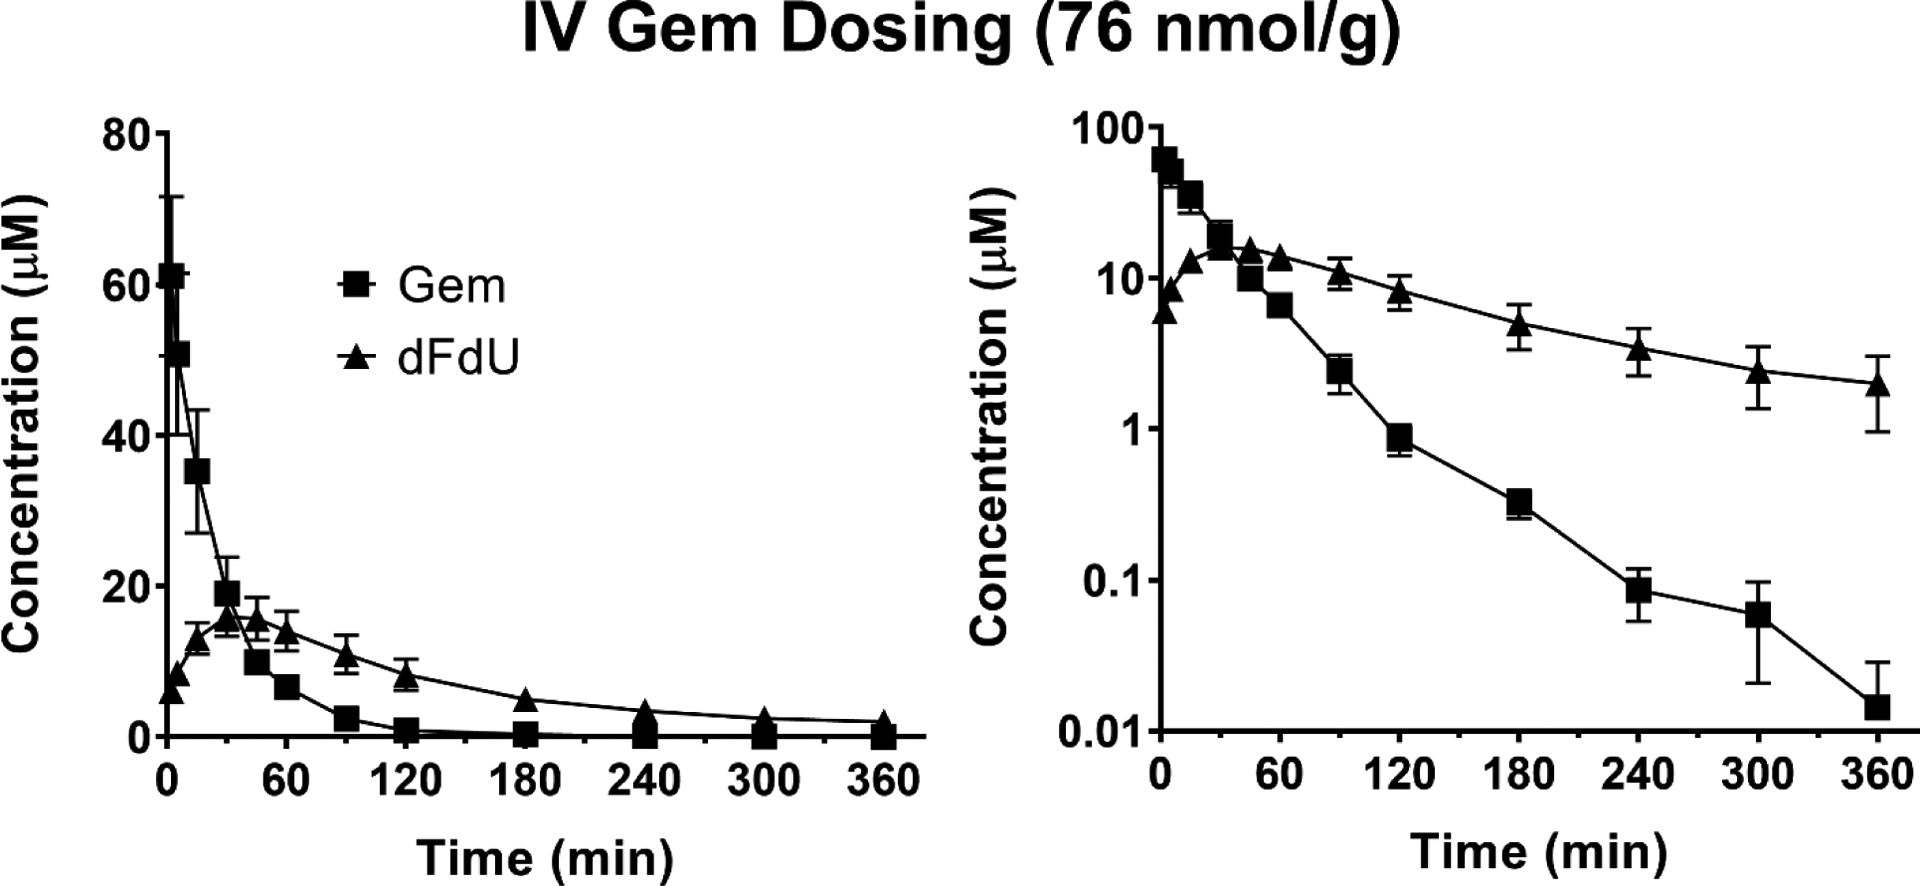
Mean plasma concentration-time profiles of Gem and dFdU following intravenous (IV) administration of 76 nmol Gem/g body weight in mice. Data are expressed as mean ± SE (n=4) with the y-axis displayed on linear (left panel) and logarithmic (right panel) scales.