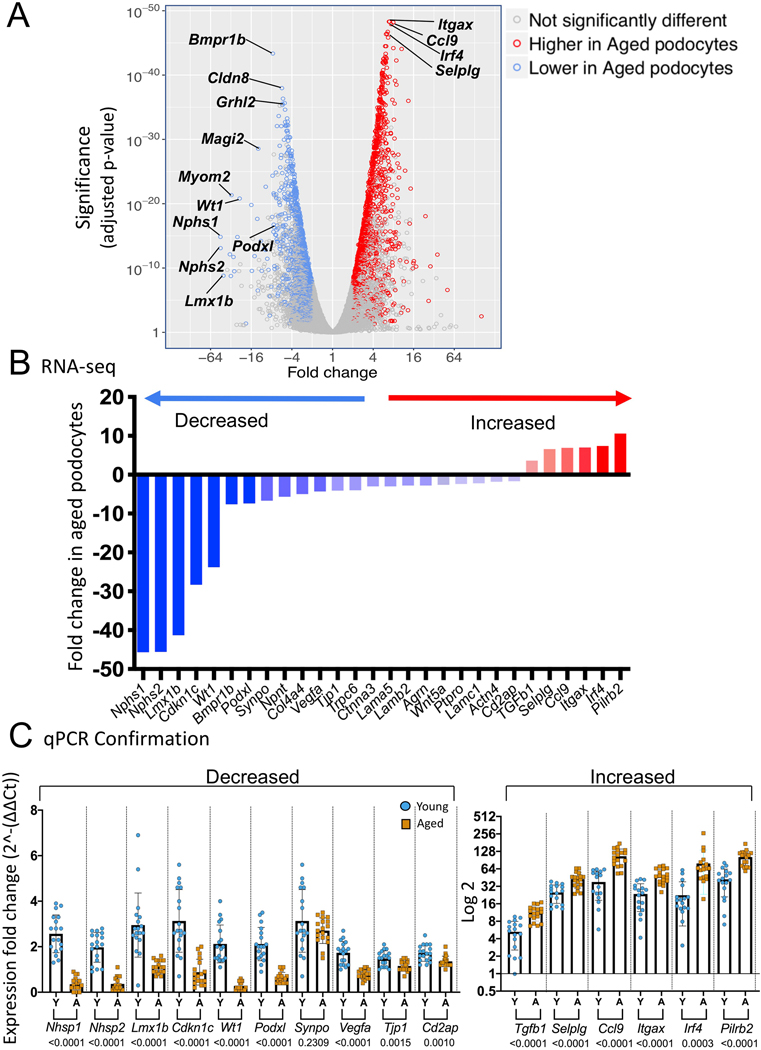
Figure 1. Differentially expressed genes (DEGs) between aged vs. young podocytes.
A) Volcano plot of differentially expressed genes (DEGs) between aged vs. young podocytes. The Y axis shows the statistical significance measured by p-value, and the X axis shows the fold change of aged vs. young podocytes (> 1 reflects higher in aged, < 1 reflects lower in aged podocytes; 4 means 4-fold higher in aged, −4 means 4-fold lower in aged). Each blue circle represents an individual gene that is lower in aged podocytes, and each red circle represents a specific gene higher in aged podocytes.
B.) Graph of critical podocyte genes significantly lower in aged podocytes (blue) and genes that were significantly higher in aged podocytes (red) as measured in the RNA-seq dataset.
C.) Graphs of qPCR of critical podocyte genes on a second cohort of podocytes isolated and analyzed from individual non-reporter mice confirm the significant decrease (left) and increase (right) in aged podocytes (all genes except Synpo had a p value of 0.0015 or lower)

