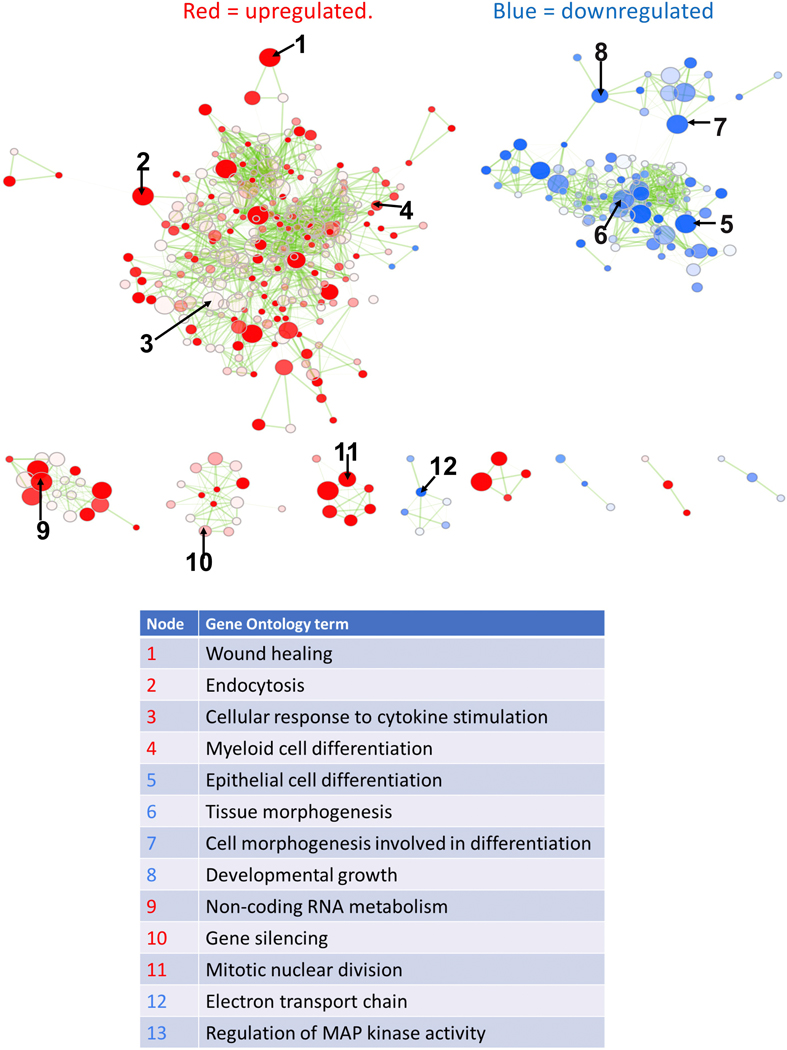
Figure 2. Perturbed biological processes in aged podocytes.
Overall, immune processes are up-regulated, and developmental, differentiation and metabolic processes down-regulated. Each node represents a gene ontology term significantly enriched in genes up-regulated in aged podocytes (red nodes) or down-regulated in aged podocytes (blue nodes). The transparency of the node is proportional to enrichment p-value: more solid-colored nodes represent more significantly enriched GO terms. Node size represent gene set size: GO terms with more genes are larger. Two nodes are connected by an edge if they have overlapping genes. Edge transparency is proportional to the number of genes shared by two GO terms. Select GO terms from each cluster are labeled for each module. Select nodes are numbered and their Gene Ontology terms are listed below.

