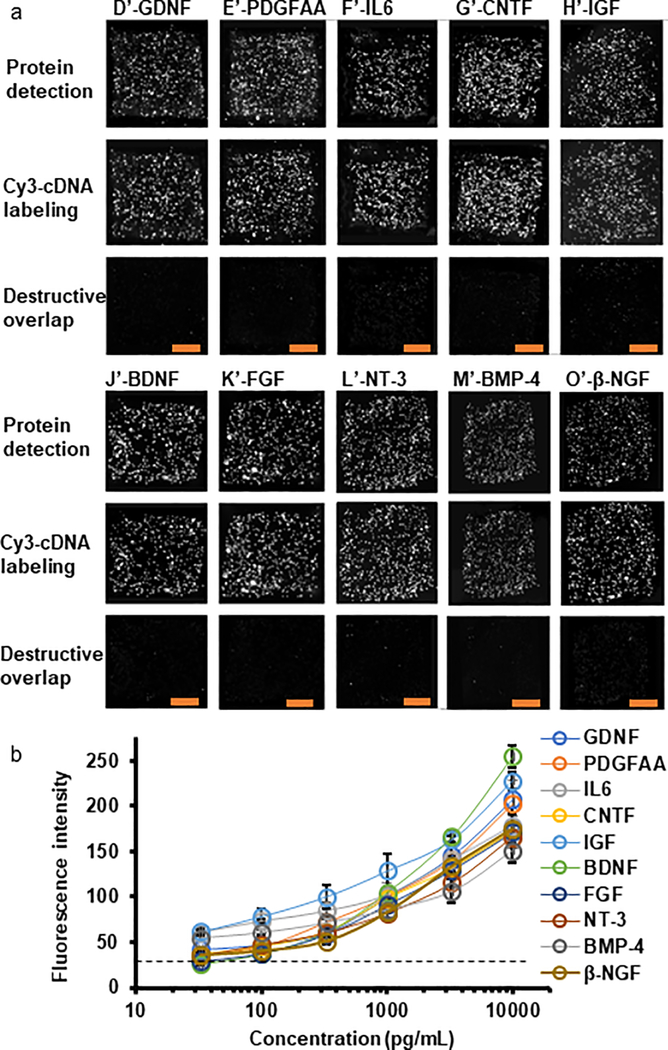
Figure 4. Crosstalk check and sensitivity of the MIST arrays for multiplexed protein detection.
(a) Validation of no crosstalk for analyzing the cytokines and growth factors in the 10-protein panel. Images of the 1st row are fluorescence signals on the MIST arrays via ELISA protein detection. Images of the 2nd row are fluorescence signals through Cy3-cDNA labeling. Each column corresponds to the protein in the multiplex panel that is coupled with a particular cDNA sequence. Subtracting fluorescence signal of the 1st row images by that of the 2nd row images results in destructive overlap images on the 3rd row. Low signal in the destructive overlap images corresponds to low crosstalk. (b) Calibration curves for immunoassays on the MIST arrays using recombinant proteins with the concentrations ranging from 33 pg/mL to 10 ng/ml. Scale bars are 100 μm. The experiments were repeated for 3 times.

