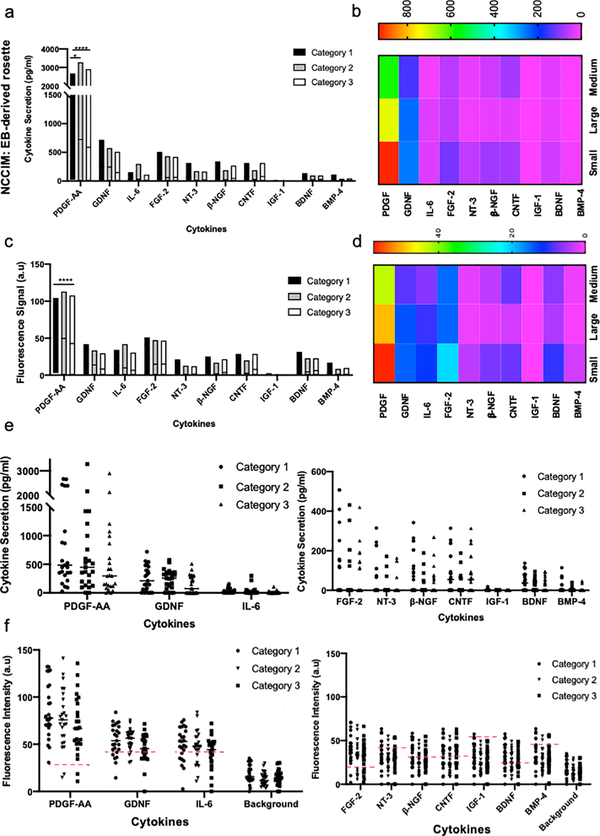
Figure 6. NCCIM cytokine detection assay of EB-derived neural rosettes.
Evaluation of EB-derived rosettes by NCCIM. (a) Plot of quantified ten proteins assayed by NCCIM in EB-derived rosettes. Plot shows the range of the data points for each cytokine. A horizontal line on each box shows the mean expression of each cytokine. The significant differences of mean values between cytokines for each category are shown in Figure S8. (b) Heatmap of quantified proteins assayed by NCCIM. (c) Plot of fluorescence signals of proteins assayed by NCCIM. Protein signal is obtained by subtracting the raw fluorescence intensity by the background + 3×SD for each protein. (d) Heatmap of fluorescence signals of proteins assayed by NCCIM. (e) Dot plots of quantify proteins produced by 3 categories of rosettes in individual microchambers. (f) Dot plots of detected fluorescence signals of proteins in individual microchambers. Red dash lines indicate the level of background + 3×SD as the cutoff for signal vs noise. P values: *, P<0.05; **, P<0.01; ***, P<0.01; ****, P<0.0001.

