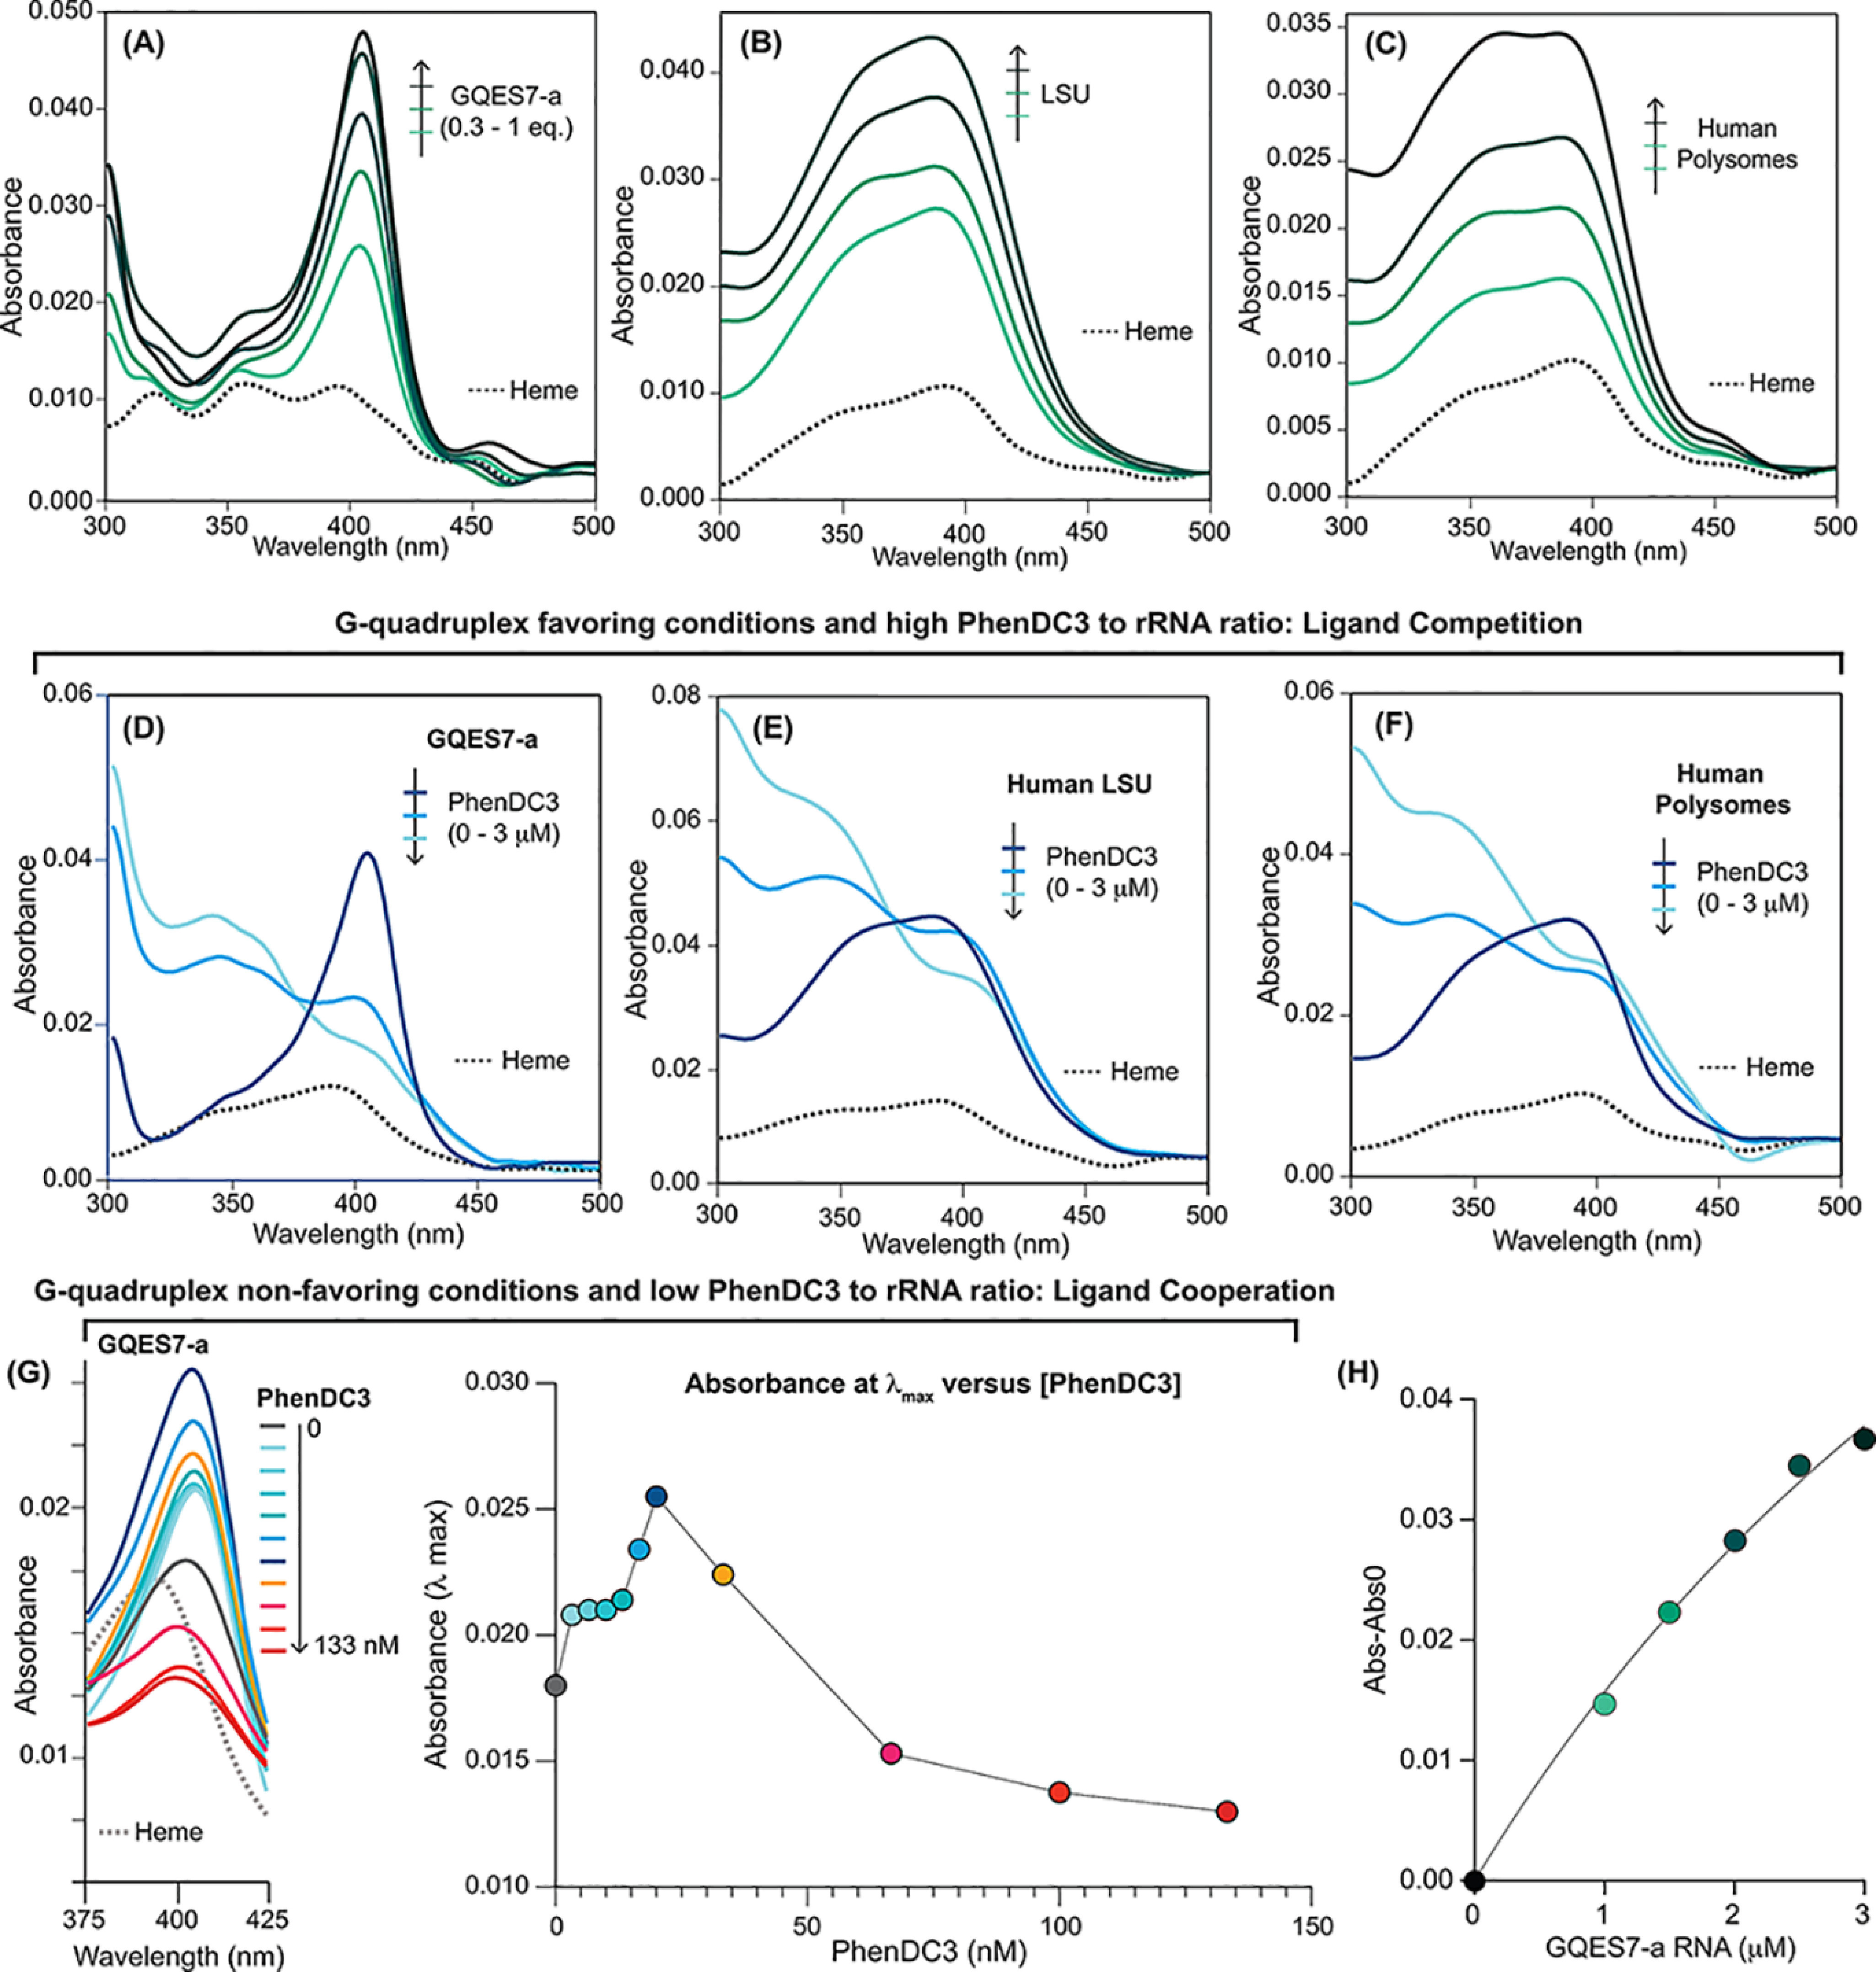
Figure 3.

Human rRNA G4s bind to heme in vitro. UV-visible spectra (the heme Soret band) during heme titration under initial conditions that favor G4 formation with (A) GQES7-a, (B) the assembled LSU, or (C) polysomes. UV-visible spectra during titration with PhenDC3 of (D) constant [heme] and [GQES7-a], (E) constant [heme] and [LSU], and (F) constant [heme] and [polysomes]. G, UV-visible spectra during titration of constant [heme] and [GQES7-a] under initial conditions that favor G4 unfolding. The absorbance at λmax versus [PhenDC3] is plotted on the panel on the right. H, plot of absorbance at 400 nm versus [GQES7-a]. Data in (A) were fit to a one-site binding model (black line) giving an apparent limiting KD of <100 nm. The experiments in panels D–F were performed using initial conditions that favored G4 formation by G-tracts (50 mm K+ with titration of PhenDC3 in the µm range). The experiment in panel G was performed using initial conditions that favored unfolded G-tracts (10 mm Li+, 0 K+ with titration of PhenDC3 nm range).
