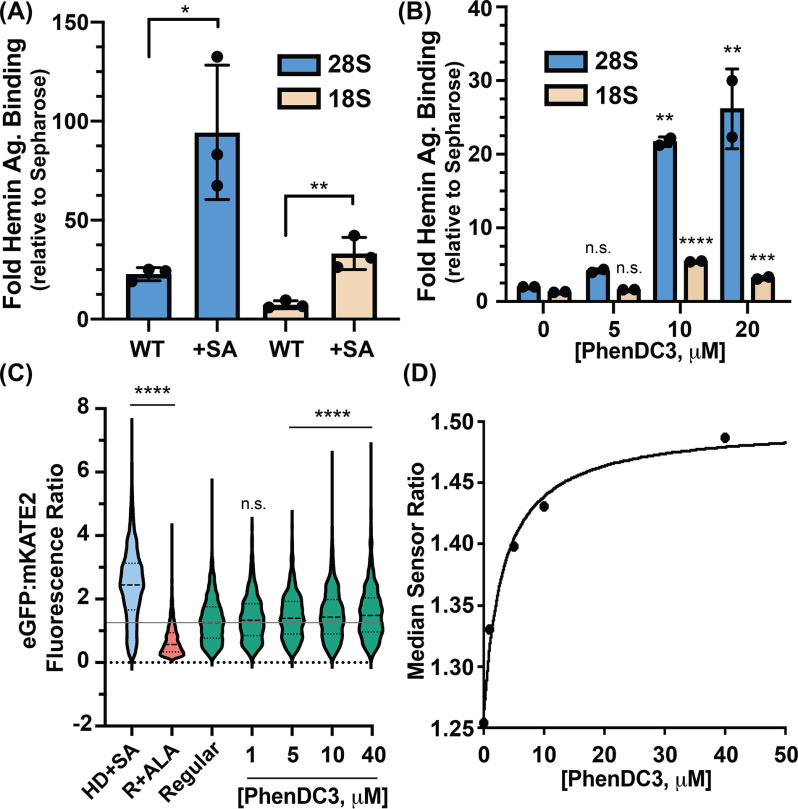
Figure 4.
Ribosomes appropriate heme in vivo through rRNA G4s. A, RT-qPCR analysis from untreated (WT) and SA-treated human cells. Statistical significance relative to WT is represented by asterisks using Student's t test. Each dot represents a biological replicate. B, RT-qPCR analysis from PhenDC3-treated HEK293 cells. Statistical significance relative to no-treatment conditions is represented by asterisks using ordinary one-way analysis of variance with Dunnett's post-hoc test. Each dot represents a technical replicate coming from individual biological replicates. The experiment was performed two times with similar dose-dependent trends (Fig. S3A). Data in (A) and (B) are represented as RNA enrichment in hemin-agarose beads relative to control Sepharose beads. C, single-cell analysis of HS1-transfected HEK293 cells grown in HD+SA, regular media containing 5-aminolevulinic acid (R+ALA), or regular media (regular) with the indicated concentrations of PhenDC3. Statistical significance relative to regular conditions is represented by asterisks using the Kruskal-Wallis analysis of variance with Dunn's post-hoc test. *p < 0.05, **p < 0.01, ***p < 0.001, ****p < 0.0001; n.s., not significant; n ≅ 1500 cells. D, median HS1 sensor ratios obtained in (C) as a function to PhenDC3 concentration.

