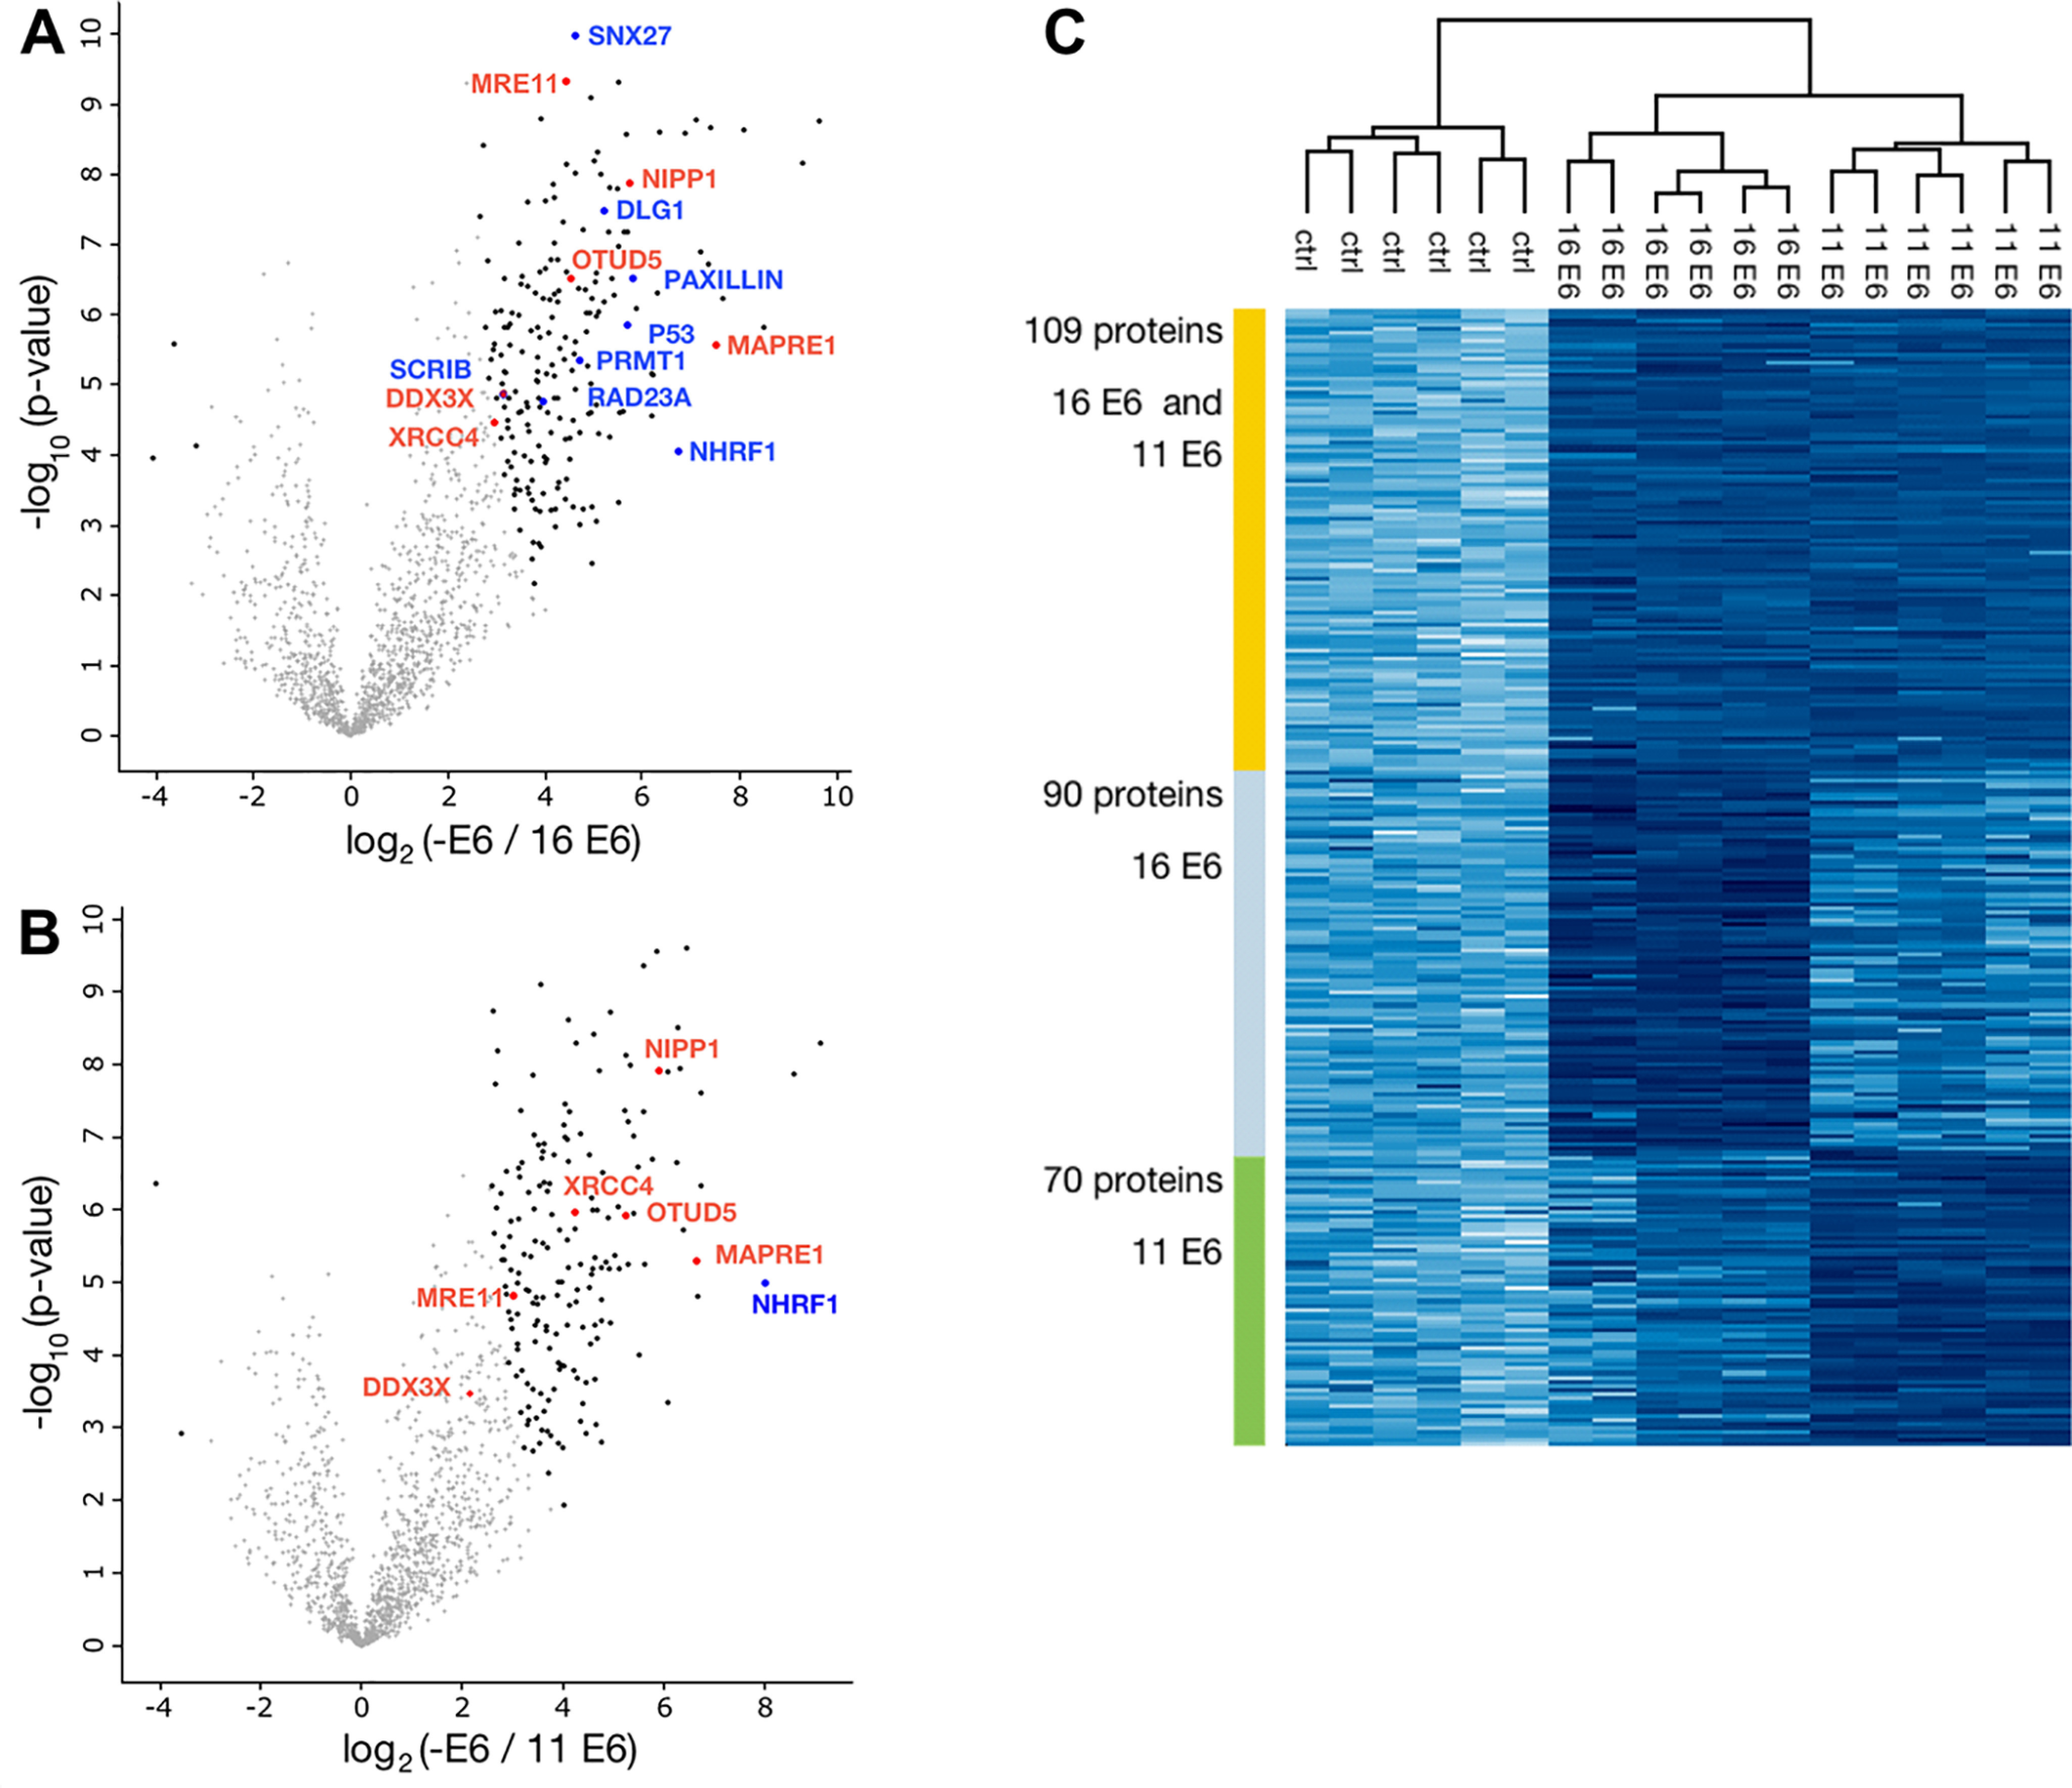
Figure 3.

Analysis of potential substrate proteins of HPV-16 E6 and HPV-11 E6. A and B, volcano plots of proteins that were significantly enriched in the presence of the E6 proteins and thus represent potential substrate proteins of HPV-16 E6 and HPV-11 E6, respectively. Significant enrichment was determined relative to proteins identified in the reactions in the absence of E6 proteins (Supporting data 1). Plotted is the log2 fold change versus the negative logarithm of the p-values. Black dots indicate significant enrichment (FDR = 0.001, S0 = 2, n = 3, two-sample t test). Blue dots/protein names indicate significant enrichment of previously reported substrate proteins or interaction partners of the E6 proteins or of E6AP (i.e. RAD23A). Red dots/protein names indicate proteins that were not reported previously to represent substrates of the E6 proteins and were selected for validation. C, heat map of proteins significantly enriched for both HPV-16 and HPV-11 E6 and HPV-16 E6 or HPV-11 E6.
