
Figure 6.
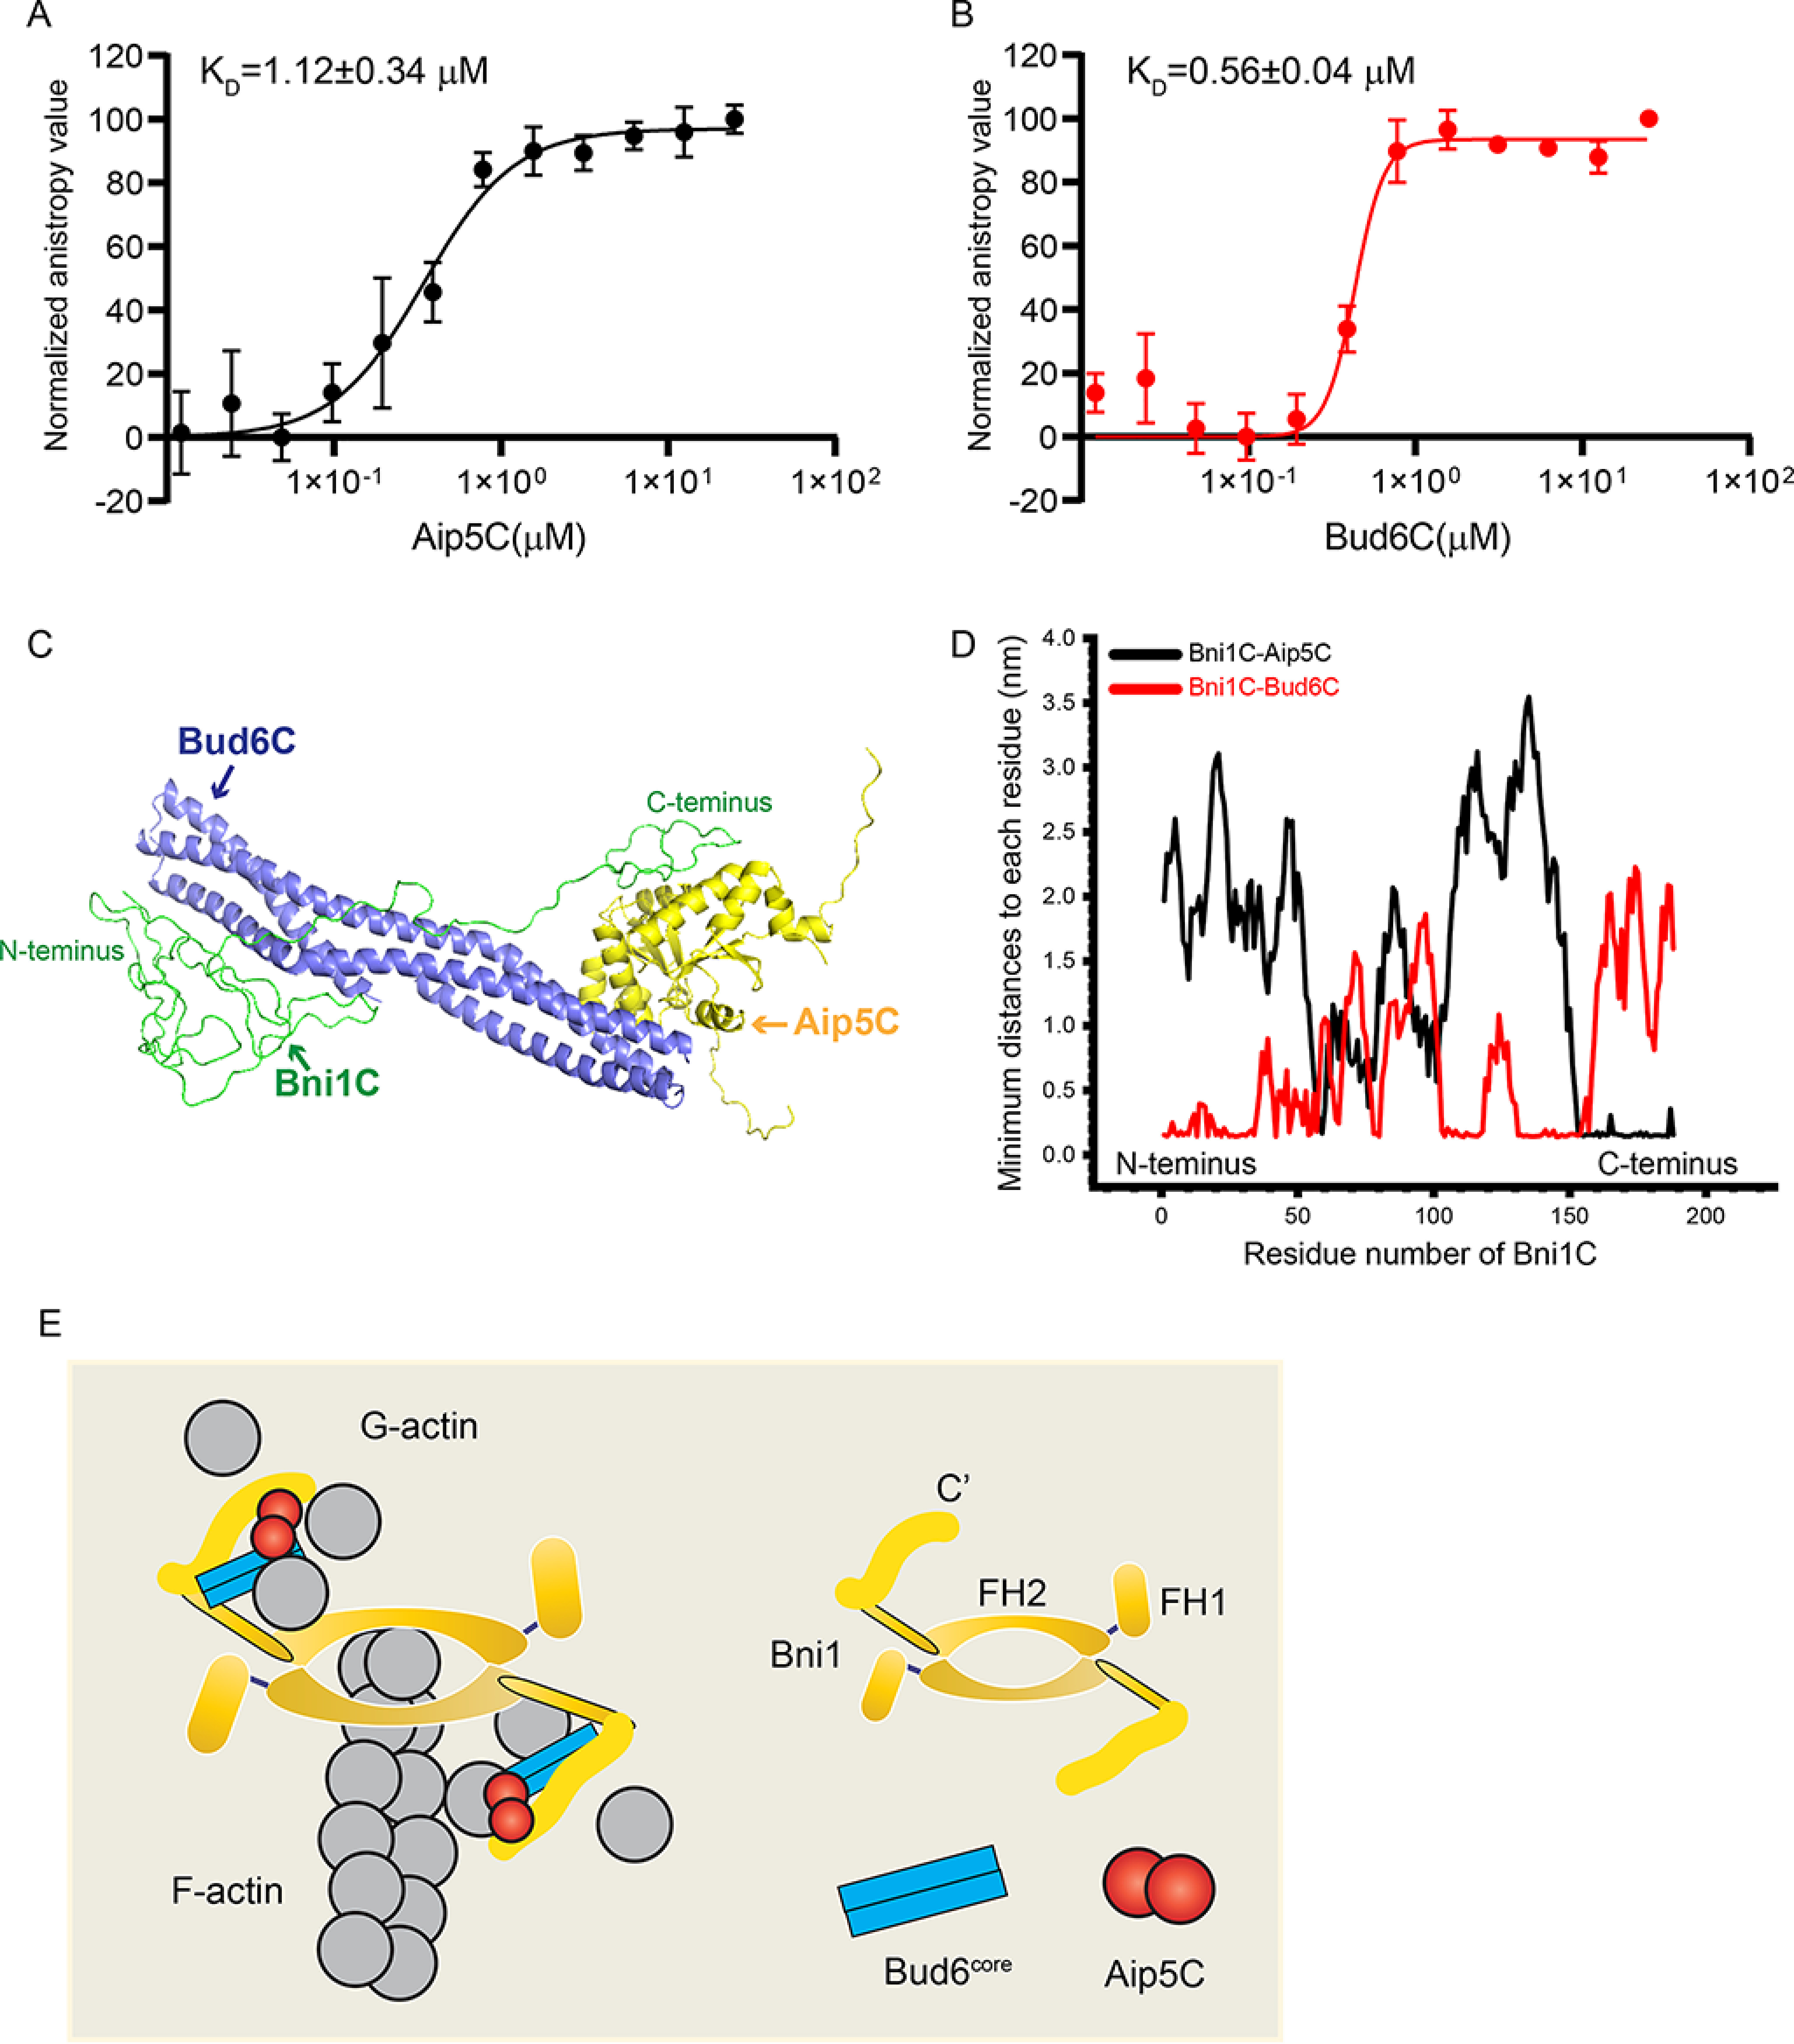
The complex organization of Bni1C-Bud6C-Aip5C. A, fluorescence anisotropy binding measurements of Alexa 488-labeled 30 nm Bni1C was titrated by a serial concentration of Aip5C. Data are represented by circles using the average value of three biological replicates and fitted by Hill equation to determine the KD with an error bar of mean ± S.E. B, fluorescence anisotropy binding measurements of Alexa 488-labelled 30 nm Bni1C was titrated by Bud6C. Data are represented by circles using the average value of three biological replicates and fitted by Hill equation to determine the KD with an error bar of mean ± S.E. C, the most stable complex conformation (simulation 1) among the eight MD simulations, where three proteins form stable protein-protein contact interfaces. Bni1C, Aip5C, and Bud6C are shown in green, yellow, and blue, respectively. D, the minimal distance plot of each residue between Bni1C and Aip5C (black)/Bud6C (red) in the final stable complex conformation, as shown in C. E, schematic model of actin nucleation from tri-protein complex Bni1-Aip5-Bud6.