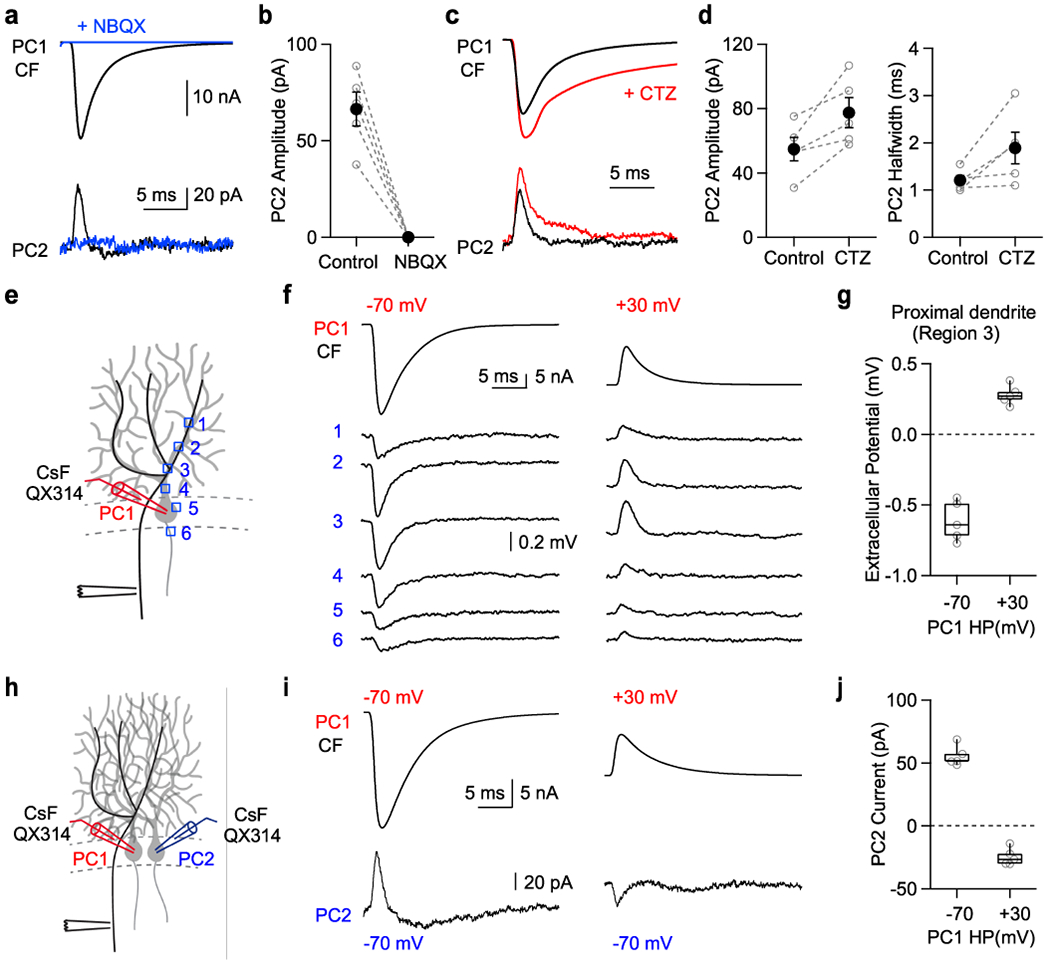
Fig. 4. Reversing the climbing fiber EPSC by AMPARs activation in one Purkinje cell reverses extracellular currents and currents in neighboring cells.

(a) The CF EPSCs in PC1 and currents recorded from nearby PC2 before (black) and after NBQX (5 μM, blue).
(b) Summary of current amplitudes for PC2.
(c) The CF EPSCs in PC1 and currents recorded from nearby PC2 before (black) and after cyclothiazide (100 μM CTZ, red).
(d) Summary of current amplitude (left) and halfwidth (right) for PC2. Two-sided paired t-test (amp;p=0.02, halfwidth;p=0.06)(e) Schematic showing climbing fiber stimulation, whole cell voltage clamp recording and extracellular recording sites.
(f) (top) Whole cell current from PC1 in voltage clamp at −70 mV (left) and +30 mV (right). (bottom) Extracellular voltage change was measured at dendrite (1-4), soma (5), and axon initial segment (6) indicated in (E).
(g) Summary of the extracellular potential at the proximal dendrite (region 3).
(h) Schematic showing paired recording with cesium fluoride (CsF) internal solution supplemented with the intracellular sodium channel antagonist QX314 (1 mM).
(i) Climbing fiber EPSC from PC1 in voltage clamp at −70 mV (left) and +30 mV (right), and corresponding whole cell currents from nearby PC2 (HP=−70 mV).
(j) Summary of the effects of the holding potential in PC1 on the currents measured in PC2 following climbing fiber activation of PC1.
Error bars indicate mean ± s.e.m. Box plots indicate median and interquartile range with the whiskers indicating the range.
