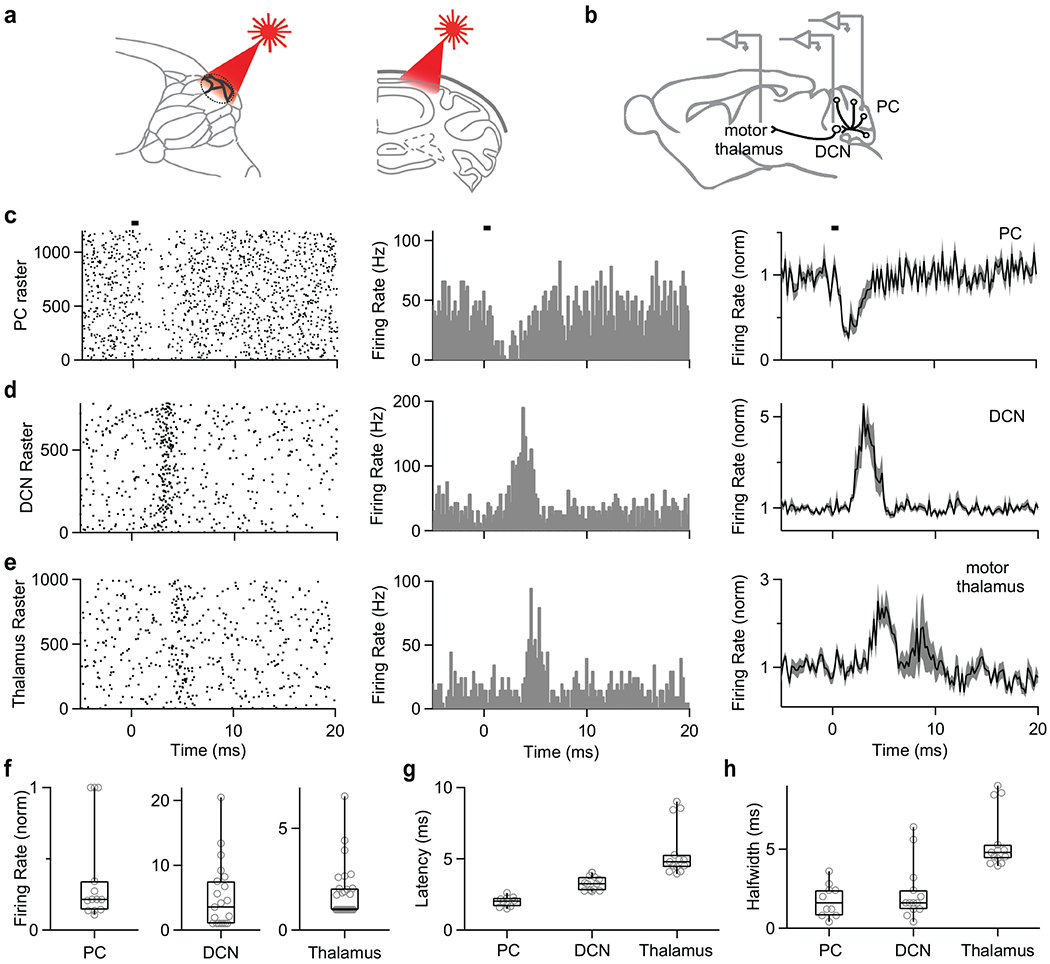
Fig. 8. Brief suppression of Purkinje cell simple spikes increases firing in the DCN and thalamus.

(a) Schematics showing craniotomy and illumination of a region of the cerebellar cortex.
(b) Schematics showing in vivo recording in PC, DCN, and thalamus.
(c) Raster plot of simple spikes from single PC (left). Histogram summarizing the data from left raster plot (middle). Average firing rate of simple spikes from PC by light stimulation (n=13 cells). Shaded grey is SEM (right). Bar indicates 0.5 ms light stimulation at 0 ms.
(d) Same as (c) but in the DCN. Average histogram is for all of the 21 cells in the DCN.
(e) Same as (c) but in the thalamus (average histogram is for the 14 of 30 cells that responded to simulation).
(f, g, h) Summary of normalized firing rates (f), latencies (g), and halfwidths (h) for PCs, DCN neurons, and thalamic neurons.
Data are mean ± s.e.m. Box plots indicate median and interquartile range with the whiskers indicating the range.
