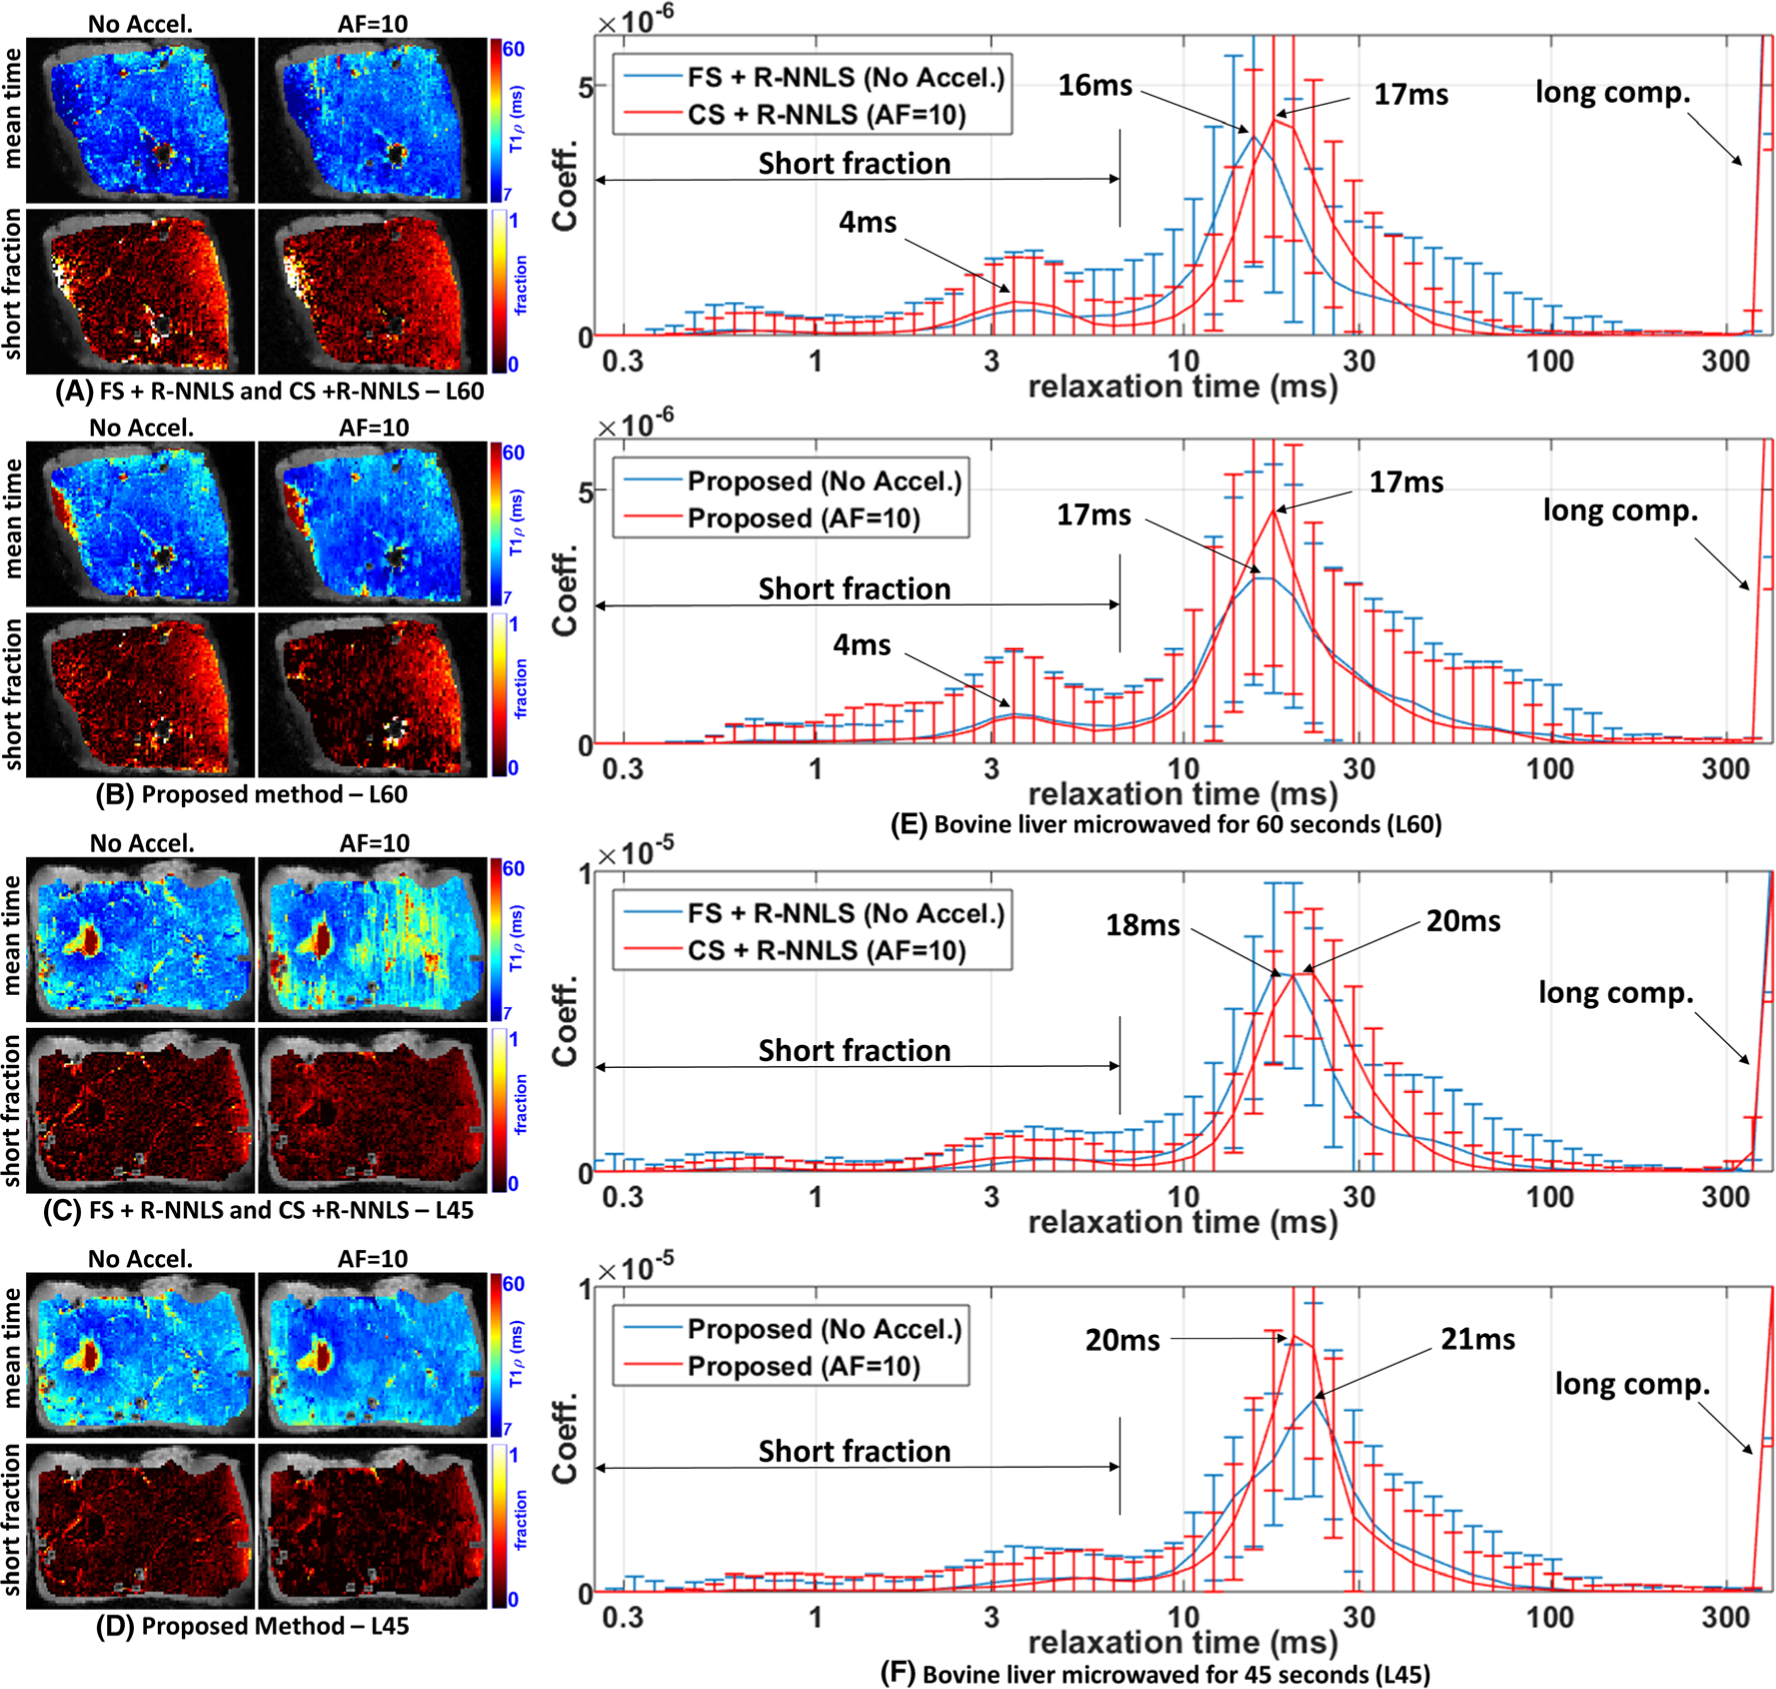
FIGURE 5.

Comparative results of the proposed method with R-NNLS considering FS data and accelerated scans. Two specimens of the bovine liver are shown, microwaved with L60 = 60 s and L45 = 45 s since they are the most similar. Spatial maps with the mean relaxation time and the short fraction are shown. A, B, Results obtained by FS + R-NNLS and CS + R-NNLS (A) and the proposed method (B) for L60. C, D, Results obtained by FS + R-NNLS and CS + R-NNLS (C) and the proposed method (D) for L45. E, F, The averaged distributions for L60 (E) and for L45 (F)
