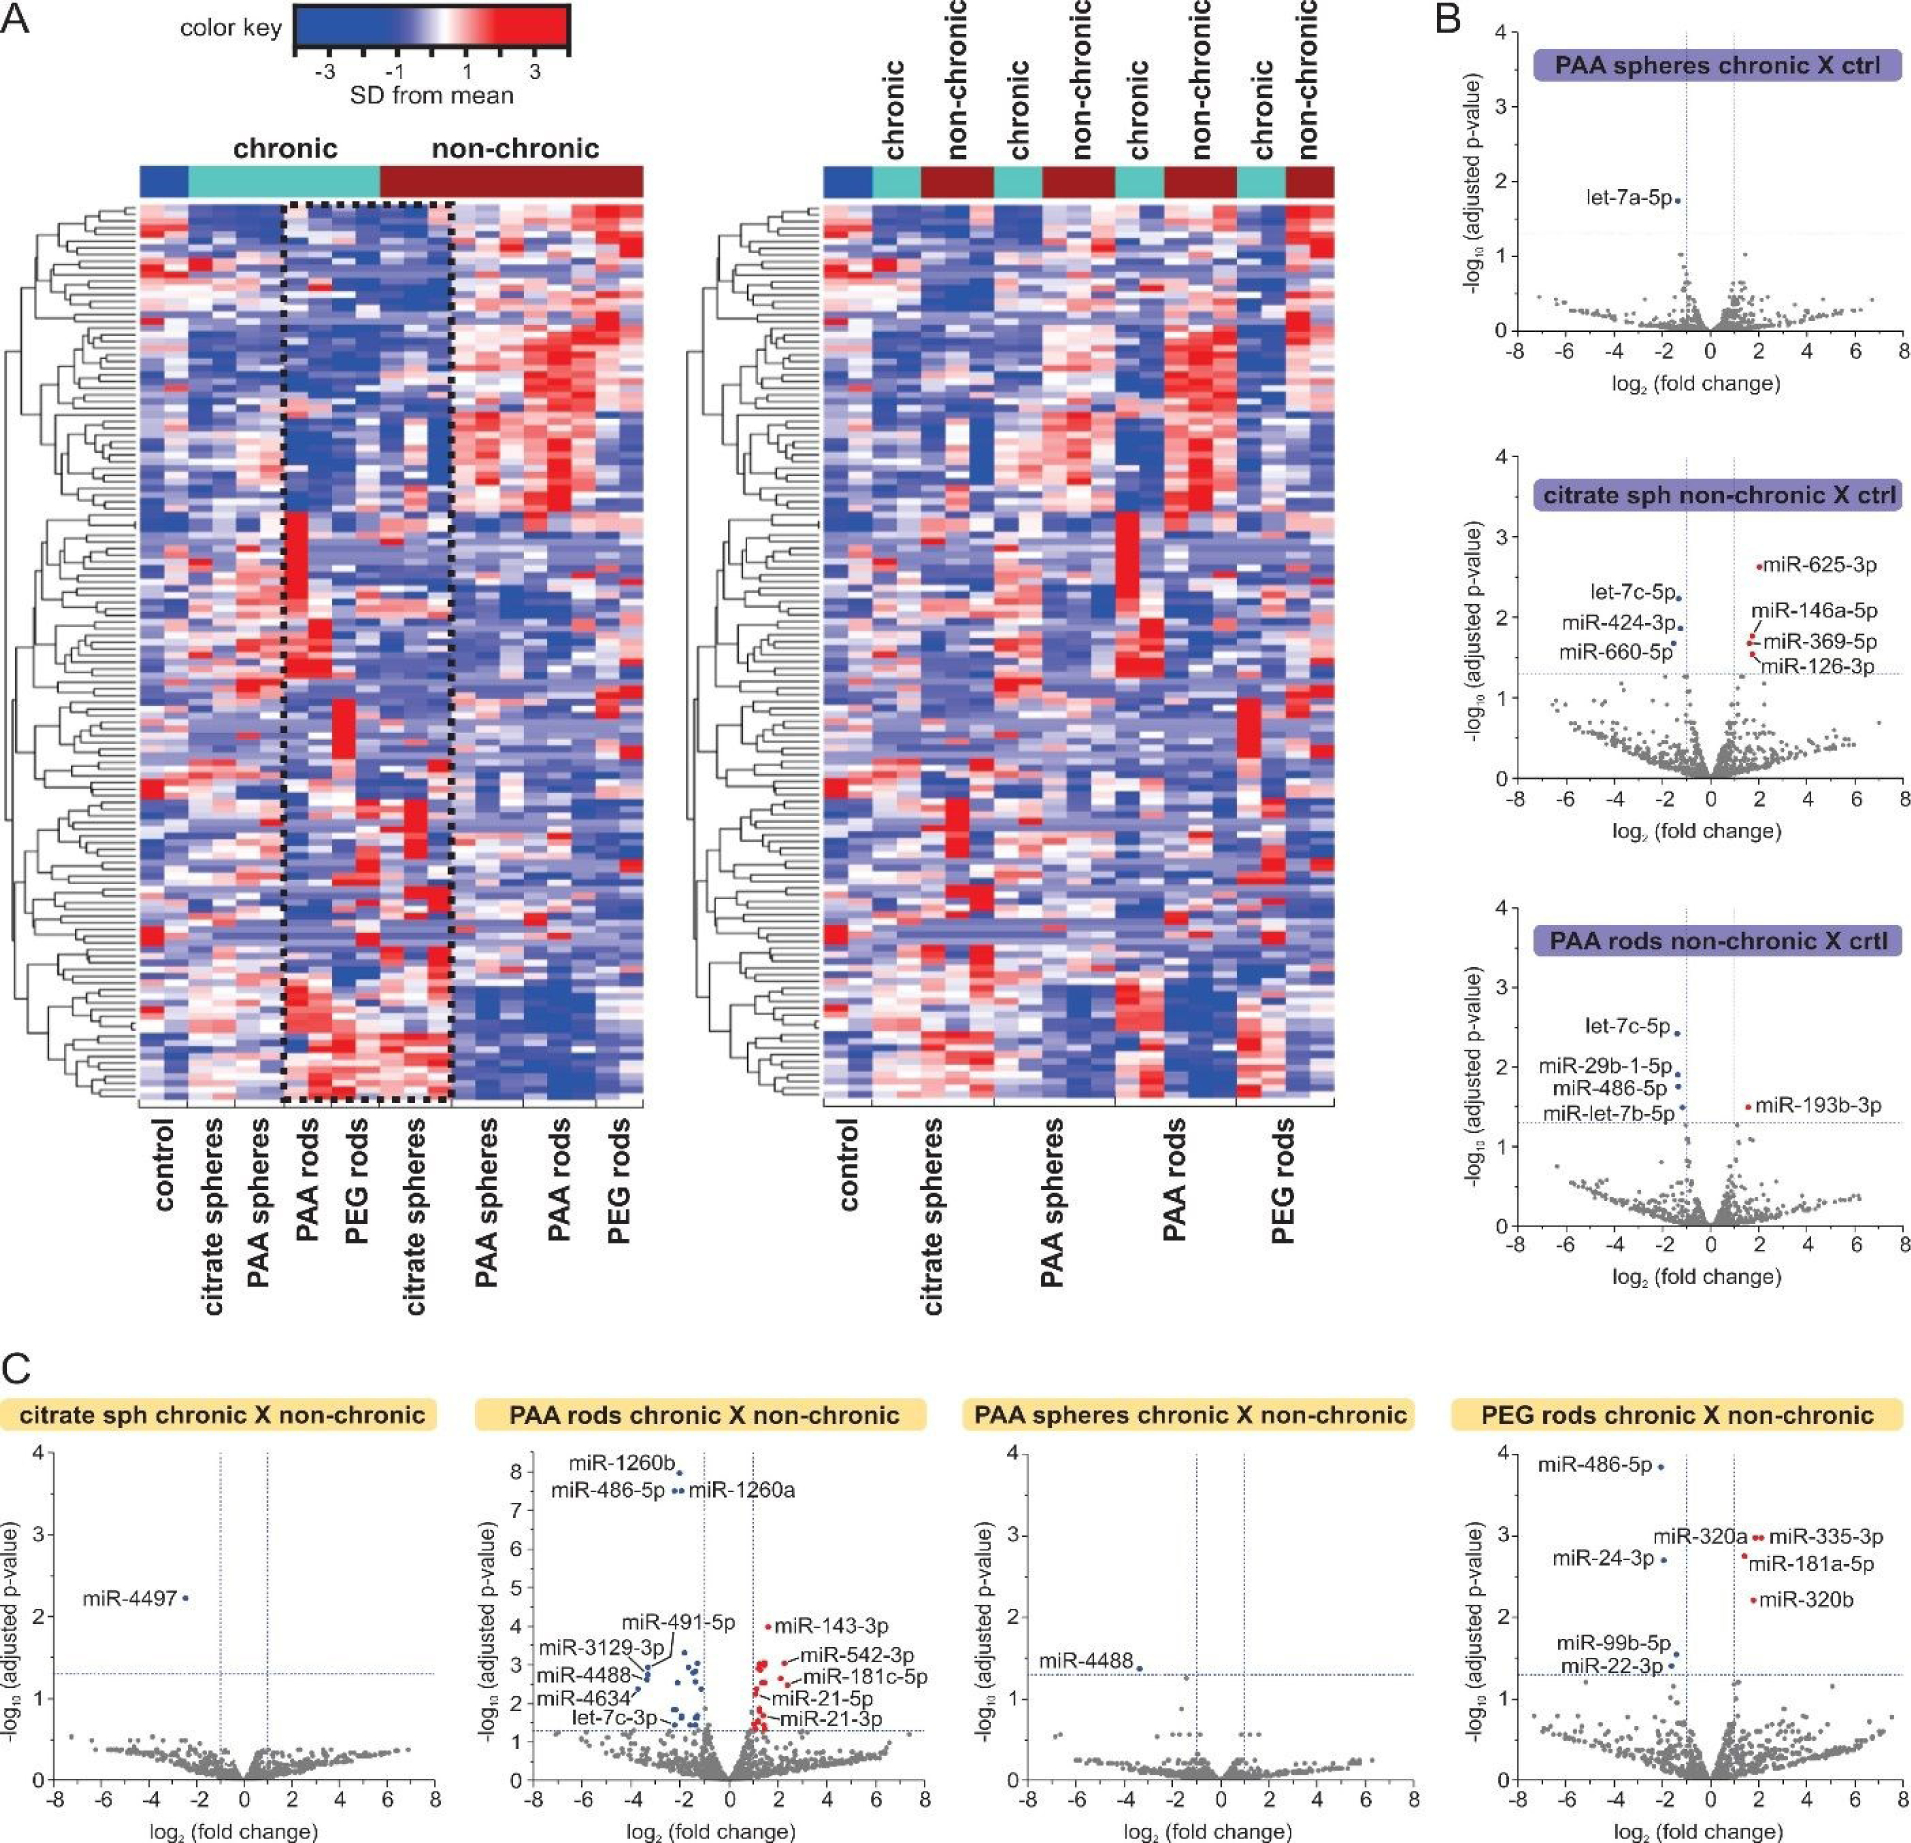
Fig. 2. miRNA expression changes after HDF cells exposure to AuNPs.

(A) Hierarchical clustering heatmaps showing changes in miRNA expression with samples grouped by exposure condition (left) and by AuNP type (right). Using a scale of standard deviations from the mean expression level, the change in expression level (one-way ANOVA, FDR<0.05) is shown as red (higher expression) or blue (lower expression) relative to the mean across all samples. Each row represents one miRNA and each column corresponds to one sample. The dotted line (2A, left) highlights the similarities between the miRNA expression profile in cells treated with citrate spheres under the non-chronic condition and samples chronically exposed to AuNPs. (B and C) Volcano plots of miRNA expression comparing cells treated with different types of AuNPs and controls (ctrl) (B), and cells treated with the same AuNP type under different conditions (C). Only comparisons showing DE miRNAs are presented. Blue dots represent miRNAs significantly downregulated while the red dots represent miRNAs significantly upregulated in treated samples (FC≥2 or≤−2, FDR<0.05).
