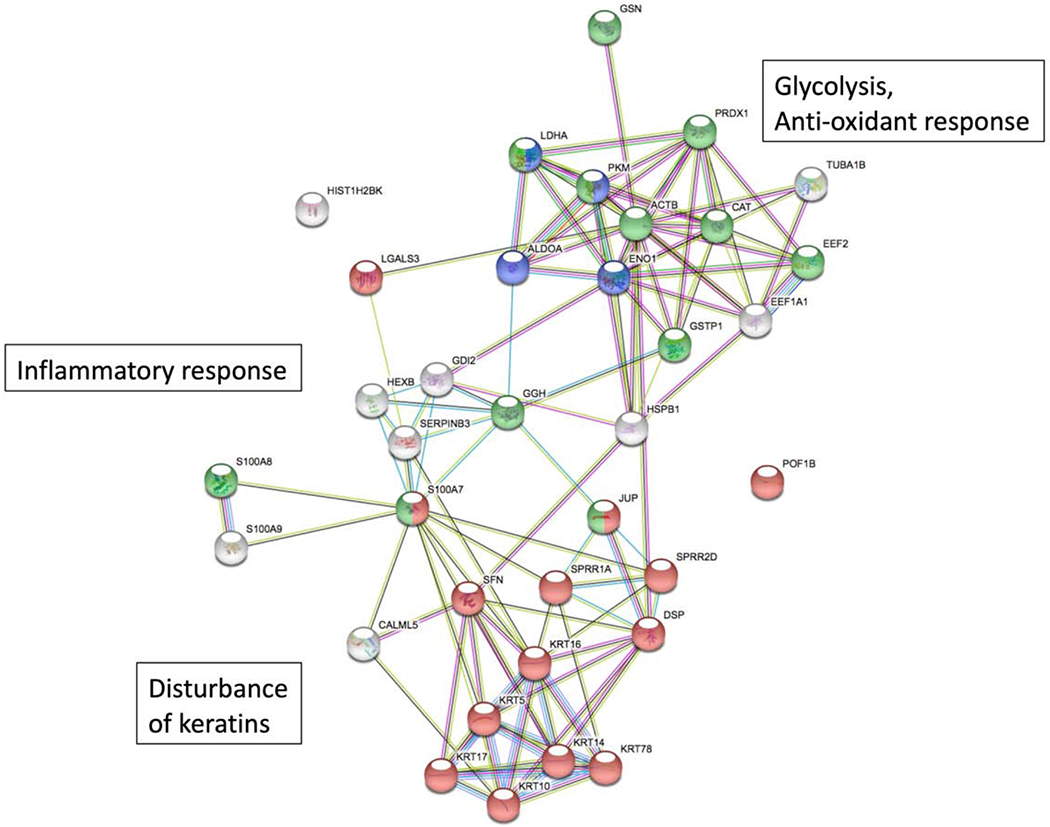
Figure 4.

Functional analysis of STS PC1 proteins. The schematic represents proteins (individual nodes) and functional groups of proteins. Differentially expressed proteins were classified with the GO terms “cytokeratins, keratinocyte development” (n=11), “inflammatory response” (n=6), “glycolysis” (n=4), and “anti-oxidant response”’ (n=4). Linear connectors indicate evidence for association in published data sets (STRING11.0; accessed September 20, 2019)
