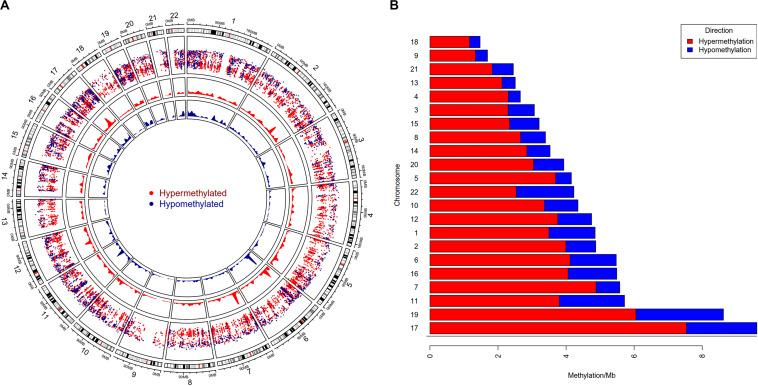
FIGURE 2.
Genome-wide differential DNA methylation pattern in Cholangiocarcinoma. (A) Distribution of differentially methylated CpGs on each chromosome. Chromosomes are shown in a clockwise direction from 1 to 22 in the outermost circle; sex chromosomes (X or Y) were omitted from the analysis. The two innermost circles display differential hypermethylation and hypomethylation frequencies in a 10 Mb sliding window throughout the genome. The penultimate outer circle with red and blue dots correspond to hypermethylated and hypomethylated CpGs, respectively, where the distance of each dot (GpG) from the inner line represents log10 of the base-pair distance between two nearest CpGs. (B) Differential DNA methylation frequency for each chromosome (per Mb) in CCA. We assessed hypermethylation and hypomethylation frequency per Mb for each chromosome and sorted chromosomes based on their frequency.

