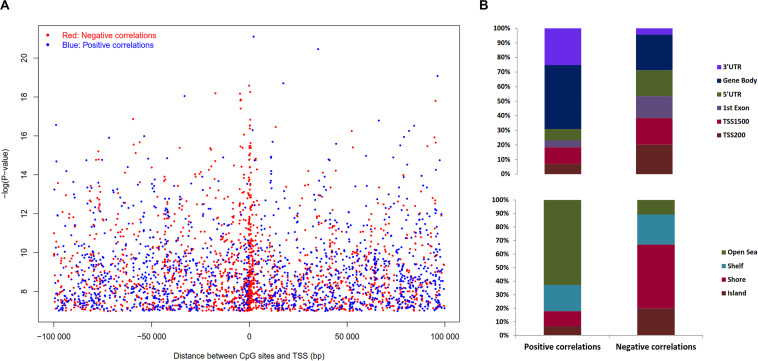
FIGURE 6.
Distribution of the CpG sites whose DNA methylation levels were strongly associated with gene expression with BH adjusted P-value < 0.05. (A) Distribution of CpGs sites significantly correlated with corresponding gene expression. The negative logarithm of BH adjusted P-value of the correlation between DNA methylation β value and gene expression plotted against distance between CpG sites and transcription start site (TSS). Red dots denote negative correlation and blue dots denote positive correlation, sex chromosomes were excluded from the analysis. (B) Distribution of CpGs correlated with gene expression in sub-regions. Percentage stacked plot of the distribution of the negative and positive correlation corresponding to the functional regions of genes. Positive and negative correlations distribution patterns are quite different for the genomic regions.

