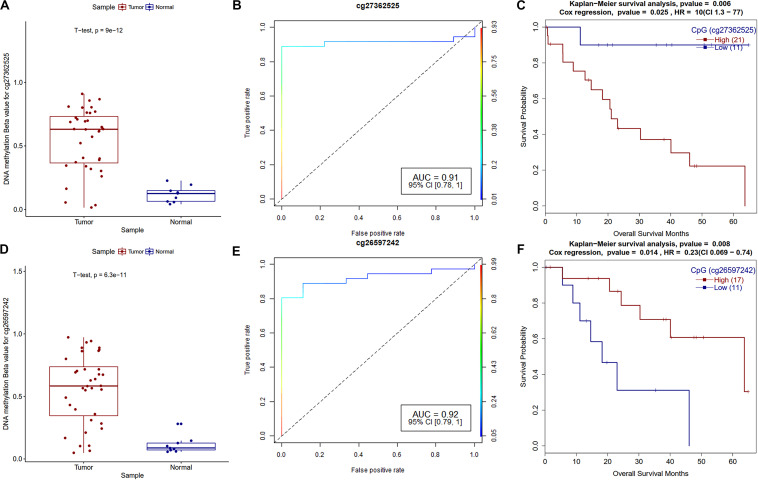
FIGURE 7.
Survival plots of differentially methylated CpGs in CCA patients. (A) Boxplot for cg27362525 tumor and normal samples with t-test p-value. (B) ROC plot for cg27362525 for logistic regression classifier model. (C) Survival plot for high vs. low methylation group for cg27362525. (D) Boxplot for cg26597242 tumor and normal samples with t-test p-value. (E) ROC plot for cg27362525 for logistic regression classifier model. (F) Survival plot for high vs. low methylation group for cg27362525.

