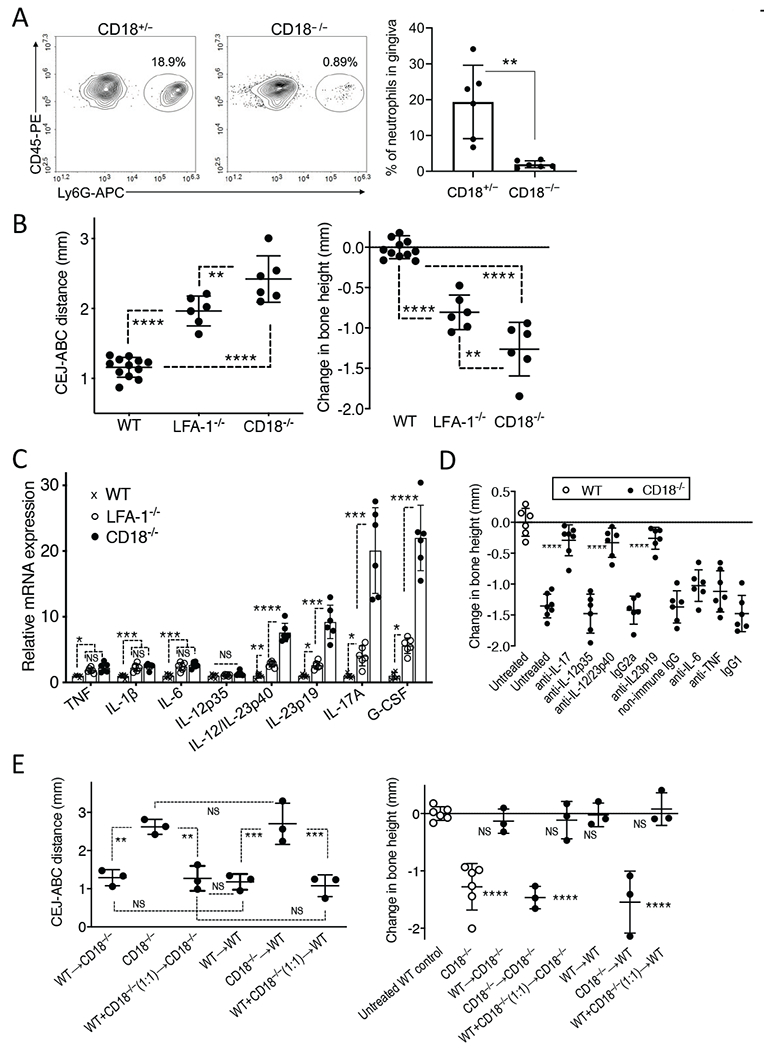
Figure 1. CD18−/− mice develop IL-23/IL-17-driven periodontal bone loss that is reversible by bone marrow transplantation.

(A) Representative FACS plot of neutrophils in the gingival tissue of CD18+/− and CD18−/− mice (left panel) and bar graph showing percentage of neutrophils gated on live, single CD45+ cells (right panel). (B,C) 18-week-old WT mice and age-matched LFA-1−/− and CD18−/− mice were assessed for the following parameters: (B) Periodontal bone heights (distance between the cementoenamel junction [CEJ] and alveolar bone crest [ABC]) in the indicated mice (left panel) and bone loss (right panel), which was calculated as bone height in 18-week-old WT control mice (“0” baseline) minus bone height in experimental (LFA-1−/− and CD18−/−) mice. (C) The mRNA expression of the indicated cytokines was determined by quantitative real-time PCR. Data were normalized against Gapdh mRNA and expressed as fold induction relative to the transcript levels of 18-week-old WT mice, assigned an average value of 1. (D) CD18−/− mice were either left untreated or were microinjected locally in the gingiva with blocking mAbs to IL-17A, IL-12p35, IL-12/IL-23p40 (or IgG2a isotype control), polyclonal anti-IL-23p19 (or non-immune IgG) antibody, blocking mAbs to IL-6, or TNF (or IgG1 isotype control) three times weekly from the age of 4 to 18 weeks. Bone loss was calculated as described in B with 18-week-old WT control mice serving as the “0” baseline. (E) Lethally irradiated 6-week-old CD18−/− or WT mice underwent transplantation with WT, CD18−/−, or a 1:1 mixture of WT and CD18−/− BM cells (5×10⁶ cells per recipient mouse). Transplanted mice were euthanized 12 weeks after BM reconstitution and bone heights were measured (left panel). Bone loss in the transplanted mice as compared to untreated WT and CD18−/− mice (data from panel B) was calculated as mean bone height in 18-week-old WT control mice (“0” baseline) minus bone height in the other indicated groups of mice. Data are means ± SD and each dot represents the value of an individual mouse (A n = 6-12 mice/group; B,C n = 6 mice/group; D n = 6-7 mice/group; E n = 3-6 mice/group). *P < 0.05, **P < 0.01, ***P < 0.001 and ****P < 0.0001 between indicated groups or as compared with corresponding isotype control (panel D) or untreated WT control (panel E right). Unpaired t test (A), one-way ANOVA with Tukey’s (B,C, E left) or Dunnet’s (D,E right) multiple-comparison tests.
