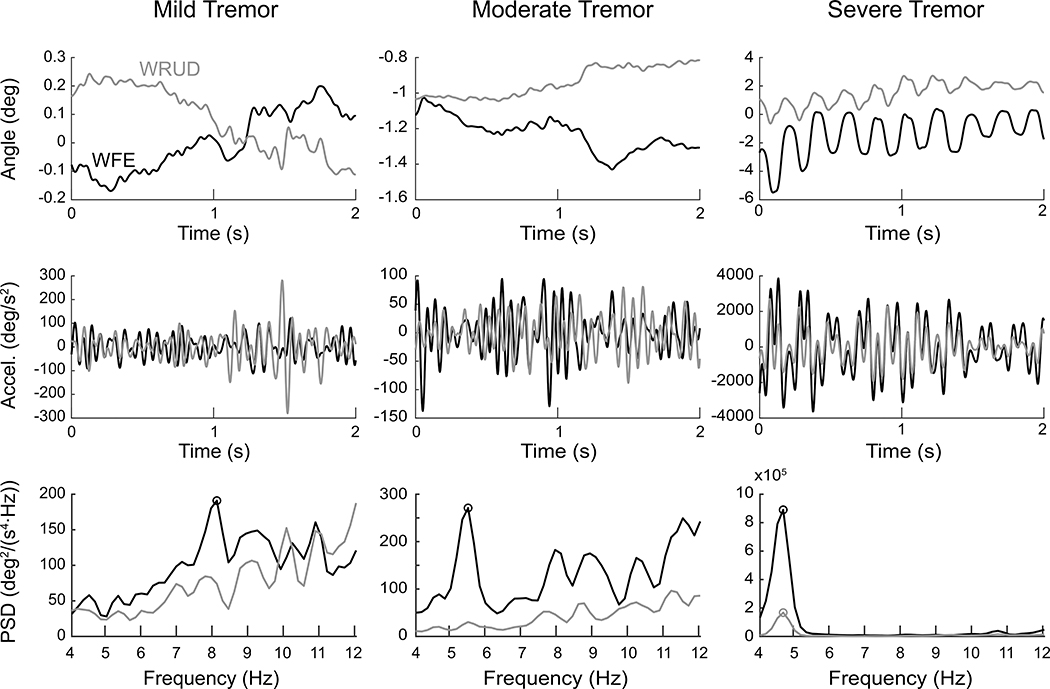
Figure 2:
Representative postural test data in wrist flexion-extension (WFE, in black) and radial-ulnar deviation (WRUD, in gray) for a mild (left), moderate (center), and severe (right) subject. The first and second rows focus on 2 seconds of a trial and show the angular displacement and filtered angular acceleration in each degree of freedom, calculated from raw sensor data using inverse kinematics. The third row shows the power spectral density (PSD) of acceleration calculated from the 30-second trial from which the 2-second portions in the top two rows were taken. The circles indicate statistically significant peaks identified by our peak-detection algorithm. Note the differences in scales between the mild, moderate, and severe cases.

