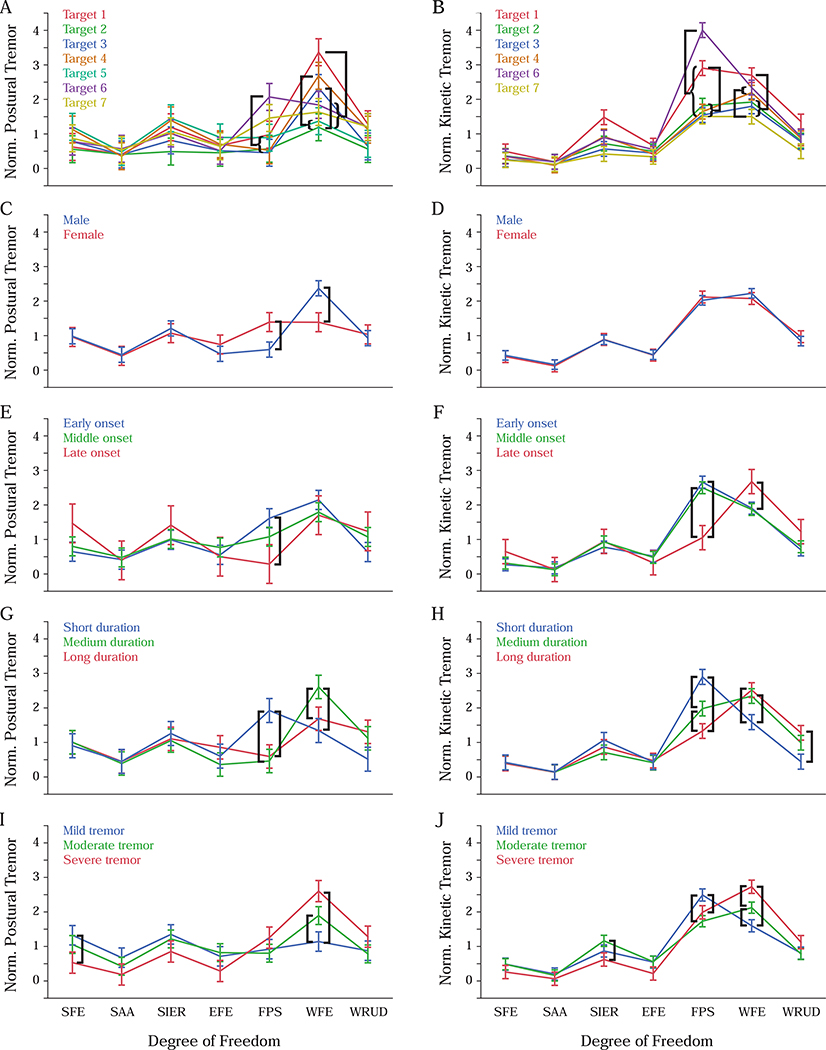
Figure 4:
Effect of target (A-B) and subject characteristics (sex (C-D), tremor onset (E-F), tremor duration (G-H), and tremor severity (I-J)) on the distribution of normalized postural tremor (left column) and normalized kinetic tremor (right column). Error bars represent ±1 standard error, and black bars indicate significant differences within a given degree of freedom (p=0.05). Degree-of-freedom abbreviations are defined in Figure 1A.

