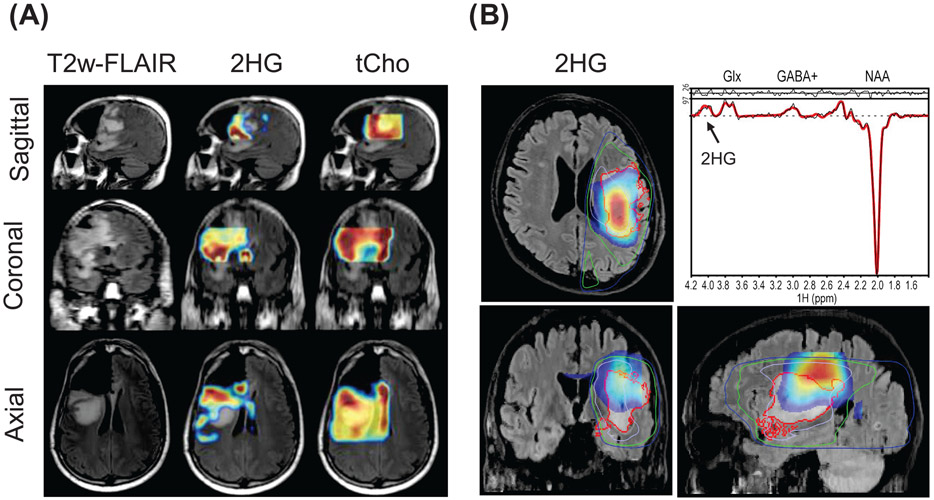
FIGURE 2.
Volumetric MRSI measurements of 2HG at 3 T. (A) 2HG maps for a glioblastoma, postsurgery. Maps were obtained using PRESS at TE = 97 ms with 3D phase encoding and are superimposed on the FLAIR MRI. From Choi C et al.58 (B) 2HG maps for a glioblastoma obtained using an editing measurement based on MEGA-LASER at TE = 68 ms and 3D stack-of-spirals. The red contours indicate the tumor margins on FLAIR image while the blue and green contours show the radiotherapy dose. From Jafari-Khouzani et al54

