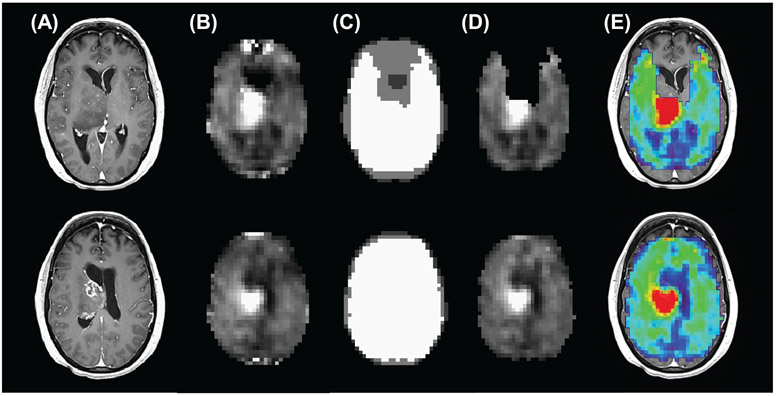
FIGURE 4.
Example of the use of quality maps to identify regions with spectra of inadequate quality, for two slices from a volumetric EPSI acquisition at 3 T, for TE = 50 ms. Shown are (A) the postcontrast T1-weighted MRI and (B) the Cho map, which shows increased signal corresponding to the location of a glioblastoma, together with several other bright signal regions. In (C) are shown the spectral quality maps, with white regions corresponding to a spectral linewidth of ≤13 Hz and gray regions for voxels with a linewidth of >13 Hz. Poor quality voxels can be removed (D), although spatial information is more clearly conveyed when combined as an overlay image with the MRI (E)

