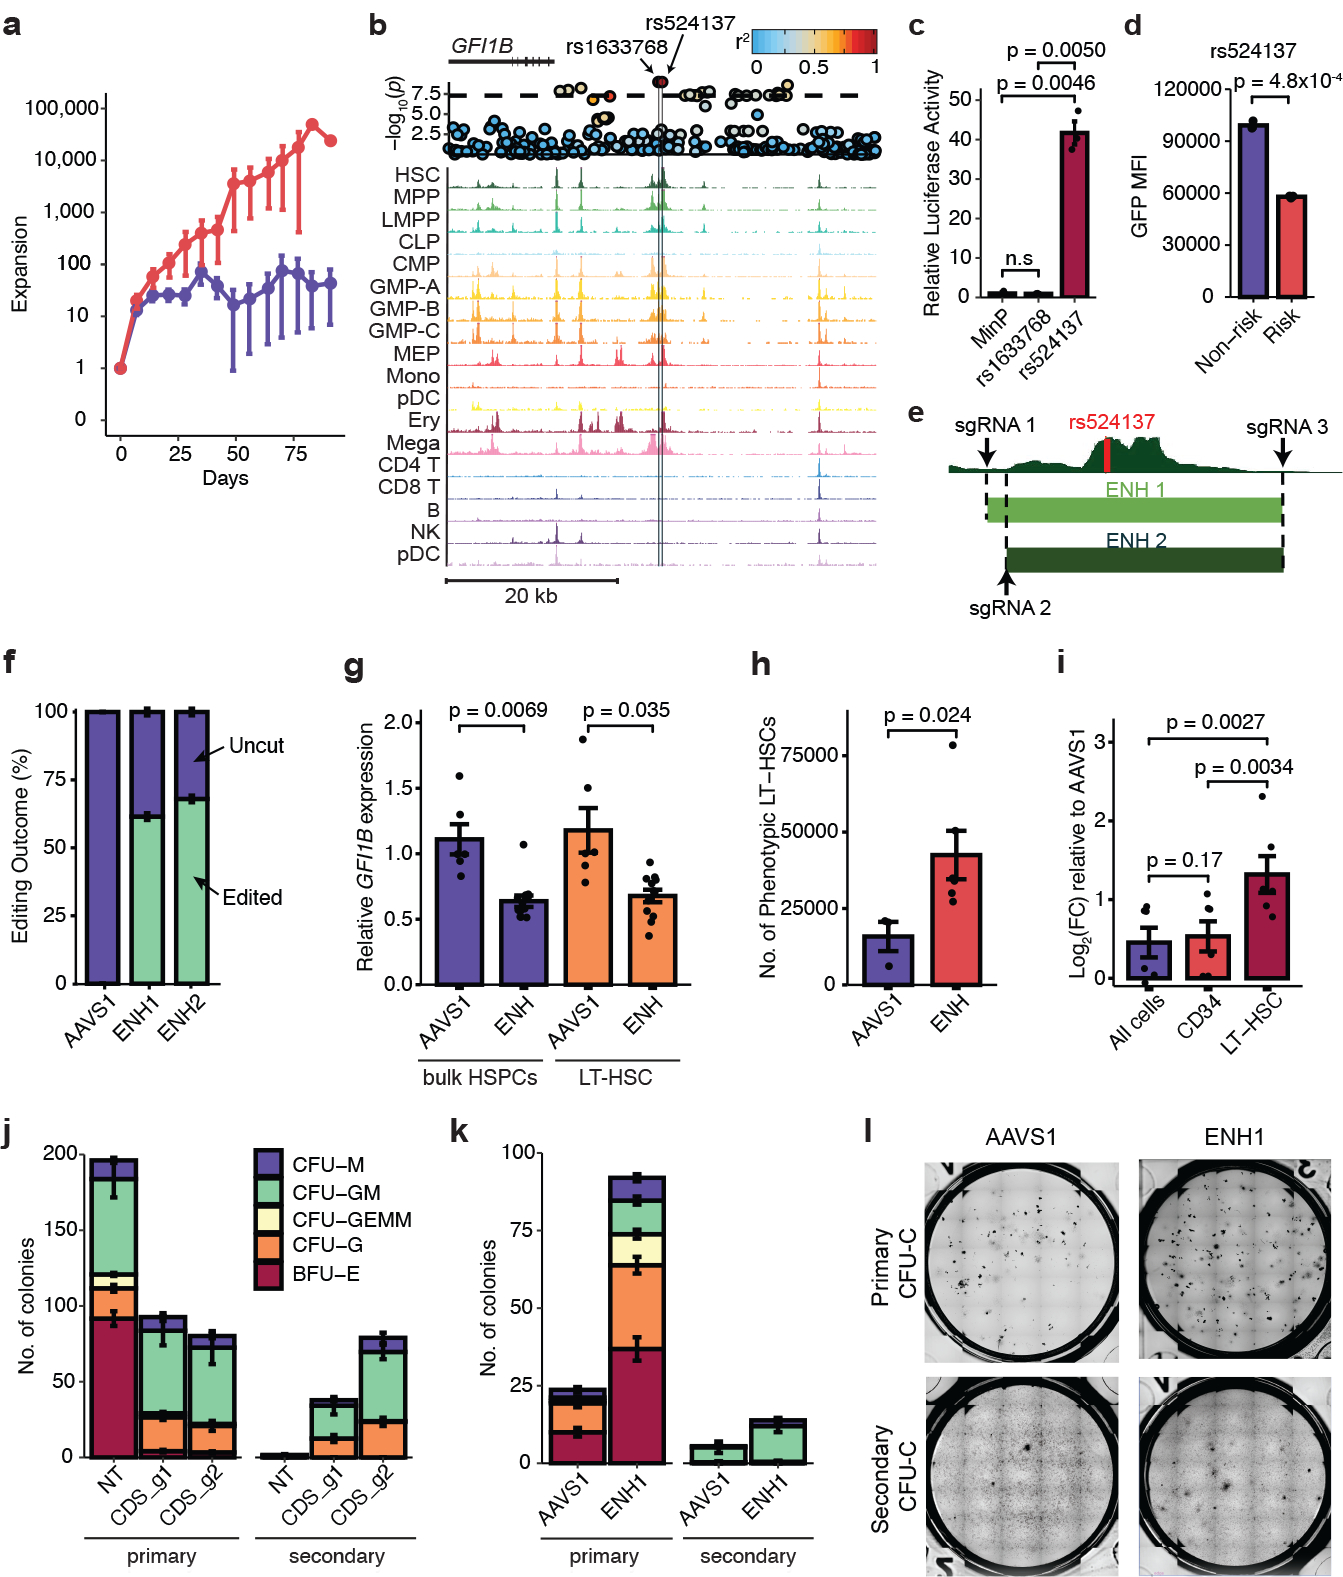
Figure 4. Characterizing the mechanisms of two MPN risk variants.

a, Expansion of Lin-CD34+ derived hematopoietic stem and progenitor cells (HSPCs) after short hairpin RNA knockdown of CHEK2 vs. control (CHEK2, n = 4; control, n = 9). b, rs1633768 and rs524137 fall in a region of hematopoietic accessible chromatin downstream of GFI1B. A locus plot is shown above, plotting -log10(p) of MPN association; color reflects linkage disequilibrium to rs524137. c, Luciferase reporter assay testing regulatory activity of genomic regions containing rs1622768 and rs524137 in hematopoietic cells compared to a minimal promoter (MinP) construct (n = 3). d, Lentiviral reporter assays testing allele-specific activity of rs524137 in hematopoietic cells (n = 3). e, HSC chromatin accessibility around rs524137 and the two CRISPR-Cas9 guide RNA pairs (ENH1 and ENH2) used to delete this region. f, Frequency of uncut and edited alleles after editing of GFI1B enhancer or control AAVS1 site in human CD34+ HSPCs (n = 6). g, GFI1B expression in bulk HSPCs and sorted phenotypic long-term HSCs (LT-HSCs) following GFI1B enhancer deletion (n = 12) compared to AAVS1 editing (n = 6). Due to similar editing outcomes, ENH1 and ENH2 were combined as ENH in this and subsequent experiments. h, Total number of phenotypic LT-HSCs in HSC maintenance culture, 6 days after editing of GFI1B enhancer (n = 6) or AAVS1 (n = 3). i, Relative expansion of cell numbers in various compartments (All cells, CD34+, and LT-HSCs) upon GFI1B enhancer deletion (n = 6) compared to AAVS1 controls (n = 3). j, GFI1B coding disruption (CDS_g1 and CDS_g2, n = 3 each) leads to reduced erythroid primary colony formation compared to non-targeting (NT) control (n = 3), but increases secondary colony formation. CFU-M, colony forming unit-macrophage; CFU-GM, granulocyte macrophage; CFU-GEMM, granulocyte erythrocyte macrophage megakaryocyte; CFU-G, granulocyte; BFU-E, burst forming unit-erythroid. k, GFI1B enhancer deletion increases secondary colony formation without affecting erythroid colony formation (n = 3). l, Representative images of primary (top) and secondary (bottom) CFU-C colonies. Data from a, c-d, f-k are means ± s.e.m. n denotes the number of biologically independent replicates. Statistical methods used were two-tailed unpaired t-test (c, d, g, h) and two-tailed paired t-test (i).
