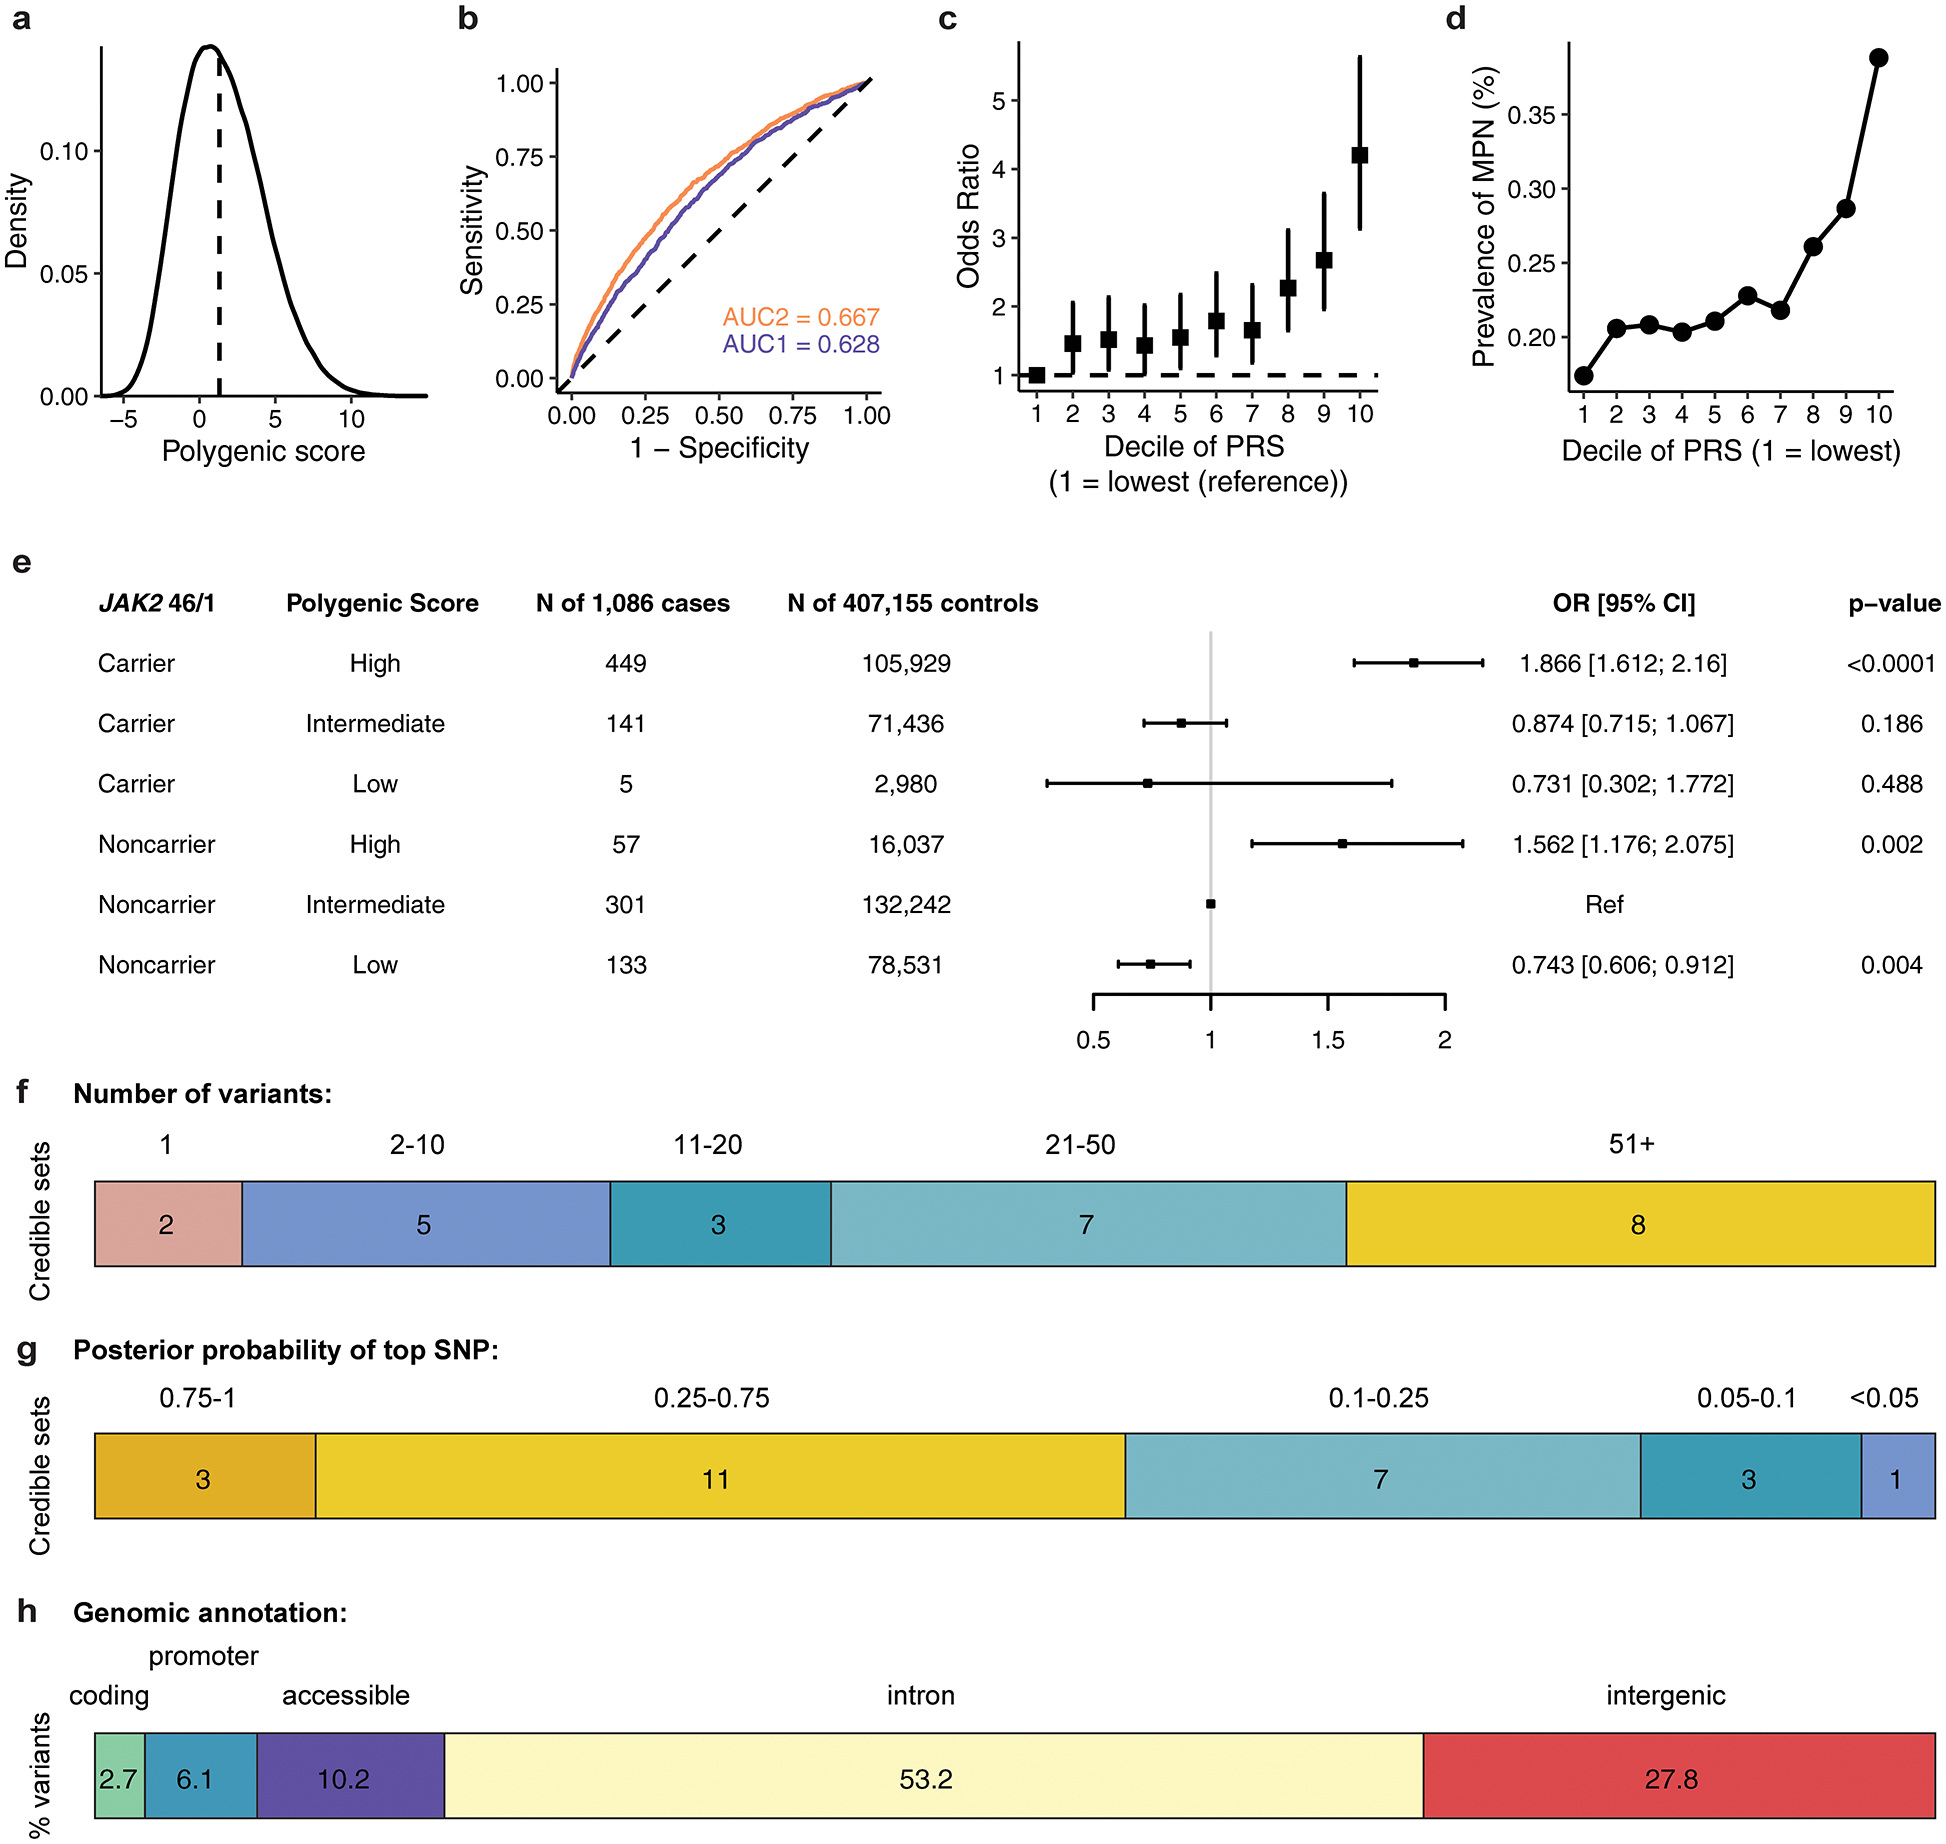
Extended Data Figure 3.

Assessing the distribution and prevalence of MPN polygenic risk score in UK Biobank. a, Density distribution of the MPN polygenic risk score (PRS) within the UK Biobank. b, Receiver operating characteristic curves for MPN predictions (n = 1,086 cases and 407,155 controls), using information from age, sex, genotyping array, and ancestry-informed principal components (AUC2, blue) alone, or with the addition of PRS (AUC1, orange). c, Odds ratio (mean and 95% confidence interval) for MPN acquisition according to deciles of the PRS (n = 1,086 cases and 407,155 controls), with decile 1 (10% of individuals with lowest PRS) as the reference group. d, Prevalence of MPN within each decile of the PRS in the UK Biobank population (n = 1,086 MPN cases, 407,155 controls). e, MPN cases and controls in the UK Biobank were stratified into three groups according to their PRS – low, intermediate, or high defined as the lowest quintile, the middle three quintiles, and the highest quintile of the PRS distribution respectively. For carriers and noncarriers of the JAK2 46/1 haplotype, the odds ratio for MPN was calculated in a logistic regression model with PRS group, age, sex, and the top ten principal components of ancestry as covariates. Non-carriers with intermediate PRS served as the reference group. Data are odds ratios and 95% confidence intervals. f, Fine-mapped 95% credible sets for all 25 MPN risk loci reaching suggestive significance, stratified by the number of variants comprising each credible set. g, The fine-mapped posterior probability of causality for the highest fine-mapped variant in each locus credible set. h, Variants within the 95% credible sets and posterior probability (PP) > 0.001 across all regions, grouped by genomic annotation.
