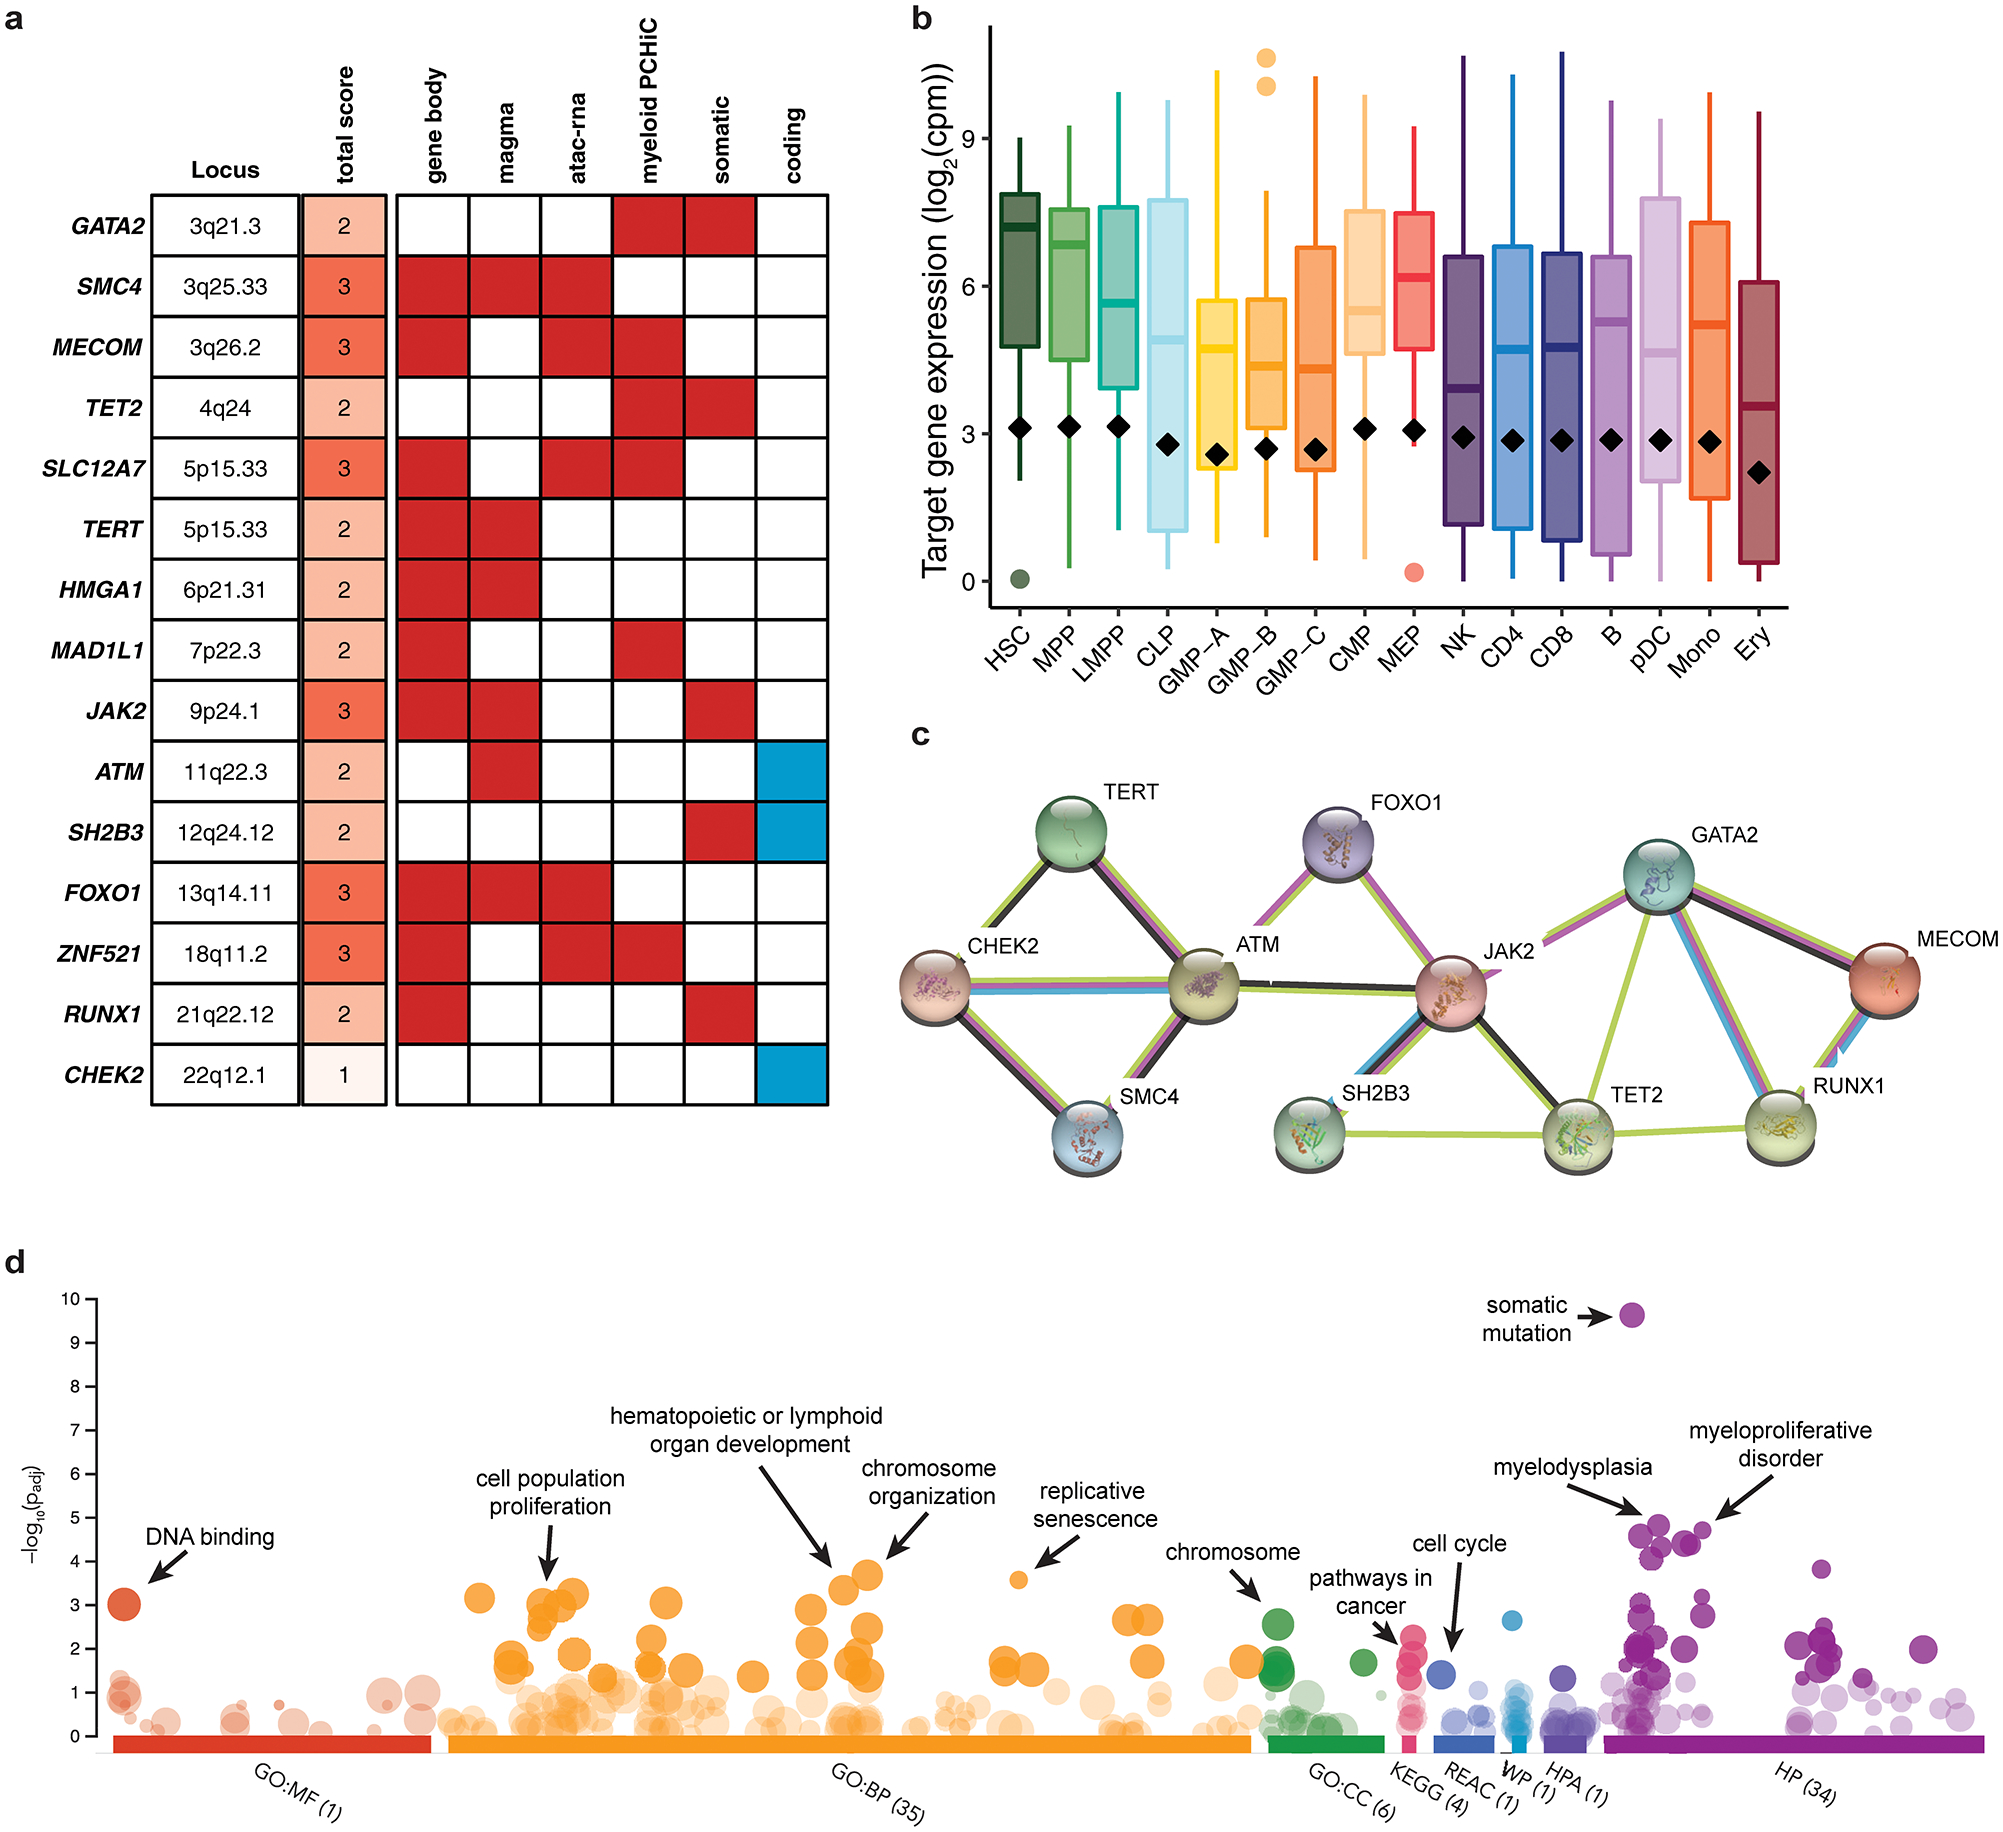
Extended Data Figure 5.

Characterizing MPN target genes. a, Target genes prioritized based on non-coding criteria (red boxes) and coding consequences (blue boxes) and scored based on the number of criteria met. Only the highest scoring gene per locus is reported, and for non-coding loci, only genes with a score of 2 or more are reported. b, Average expression (log2 counts per million) of MPN target genes (n = 15) across 16 primary hematopoietic cell types. Black diamonds indicate the mean expression of all non-zero expressed protein-coding genes in each cell type. Box plots show the median at the center, with the top and bottom of the box indicating the interquartile range. Whiskers extend to either the maximum/minimum value or 1.5x the interquartile range. c, Protein-protein interaction network showing known and predicted associations between the protein products of MPN target genes, generated with STRING database. d, Top-enriched biological annotations for MPN target genes identify key pathways associated with hematopoiesis and oncogenesis.
