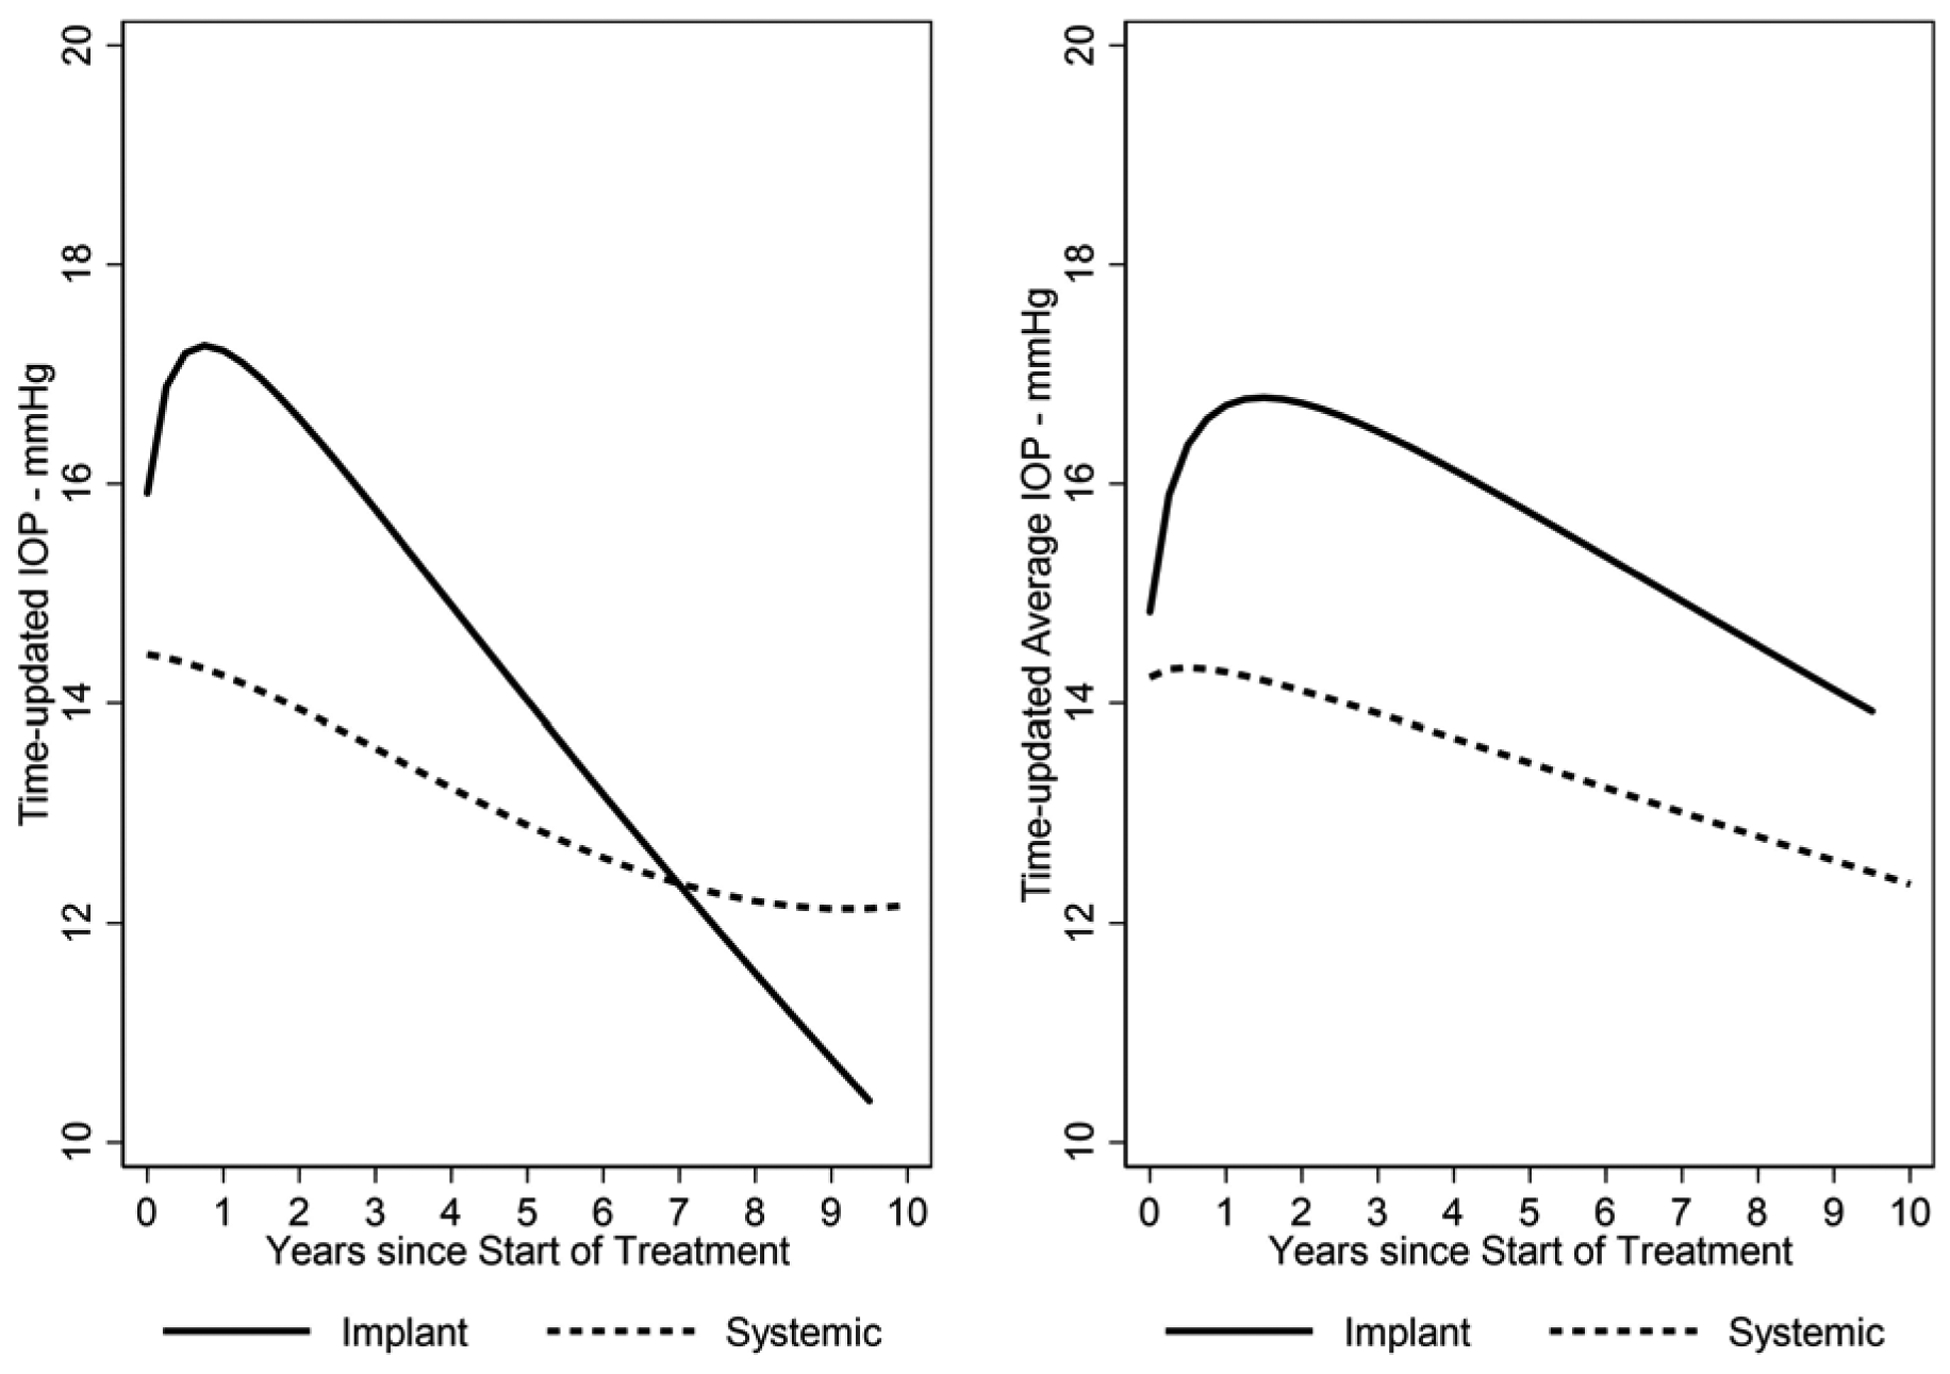
Figure 1. Intraocular Pressure (IOP) Over Time by As-Treated Treatment Group.

Right panel: Lowess curve summarizing IOP over time by treatment group. Left panel: Lowess curve summarizing the average of cumulative IOP over time by treatment group. Eyes with uveitis treated with [fluocinolone acetonide) Implant or Systemic Therapy in the Multicenter Uveitis Steroid Treatment (MUST) Trial and Follow-up Study.
