Figure 3. Distribution of parameters related to glaucoma outcome among uveitic eyes from six years before to six years after their diagnosis with glaucoma, eyes from the Multicenter Uveitis Steroid Treatment (MUST) Trial and Follow-up Study.
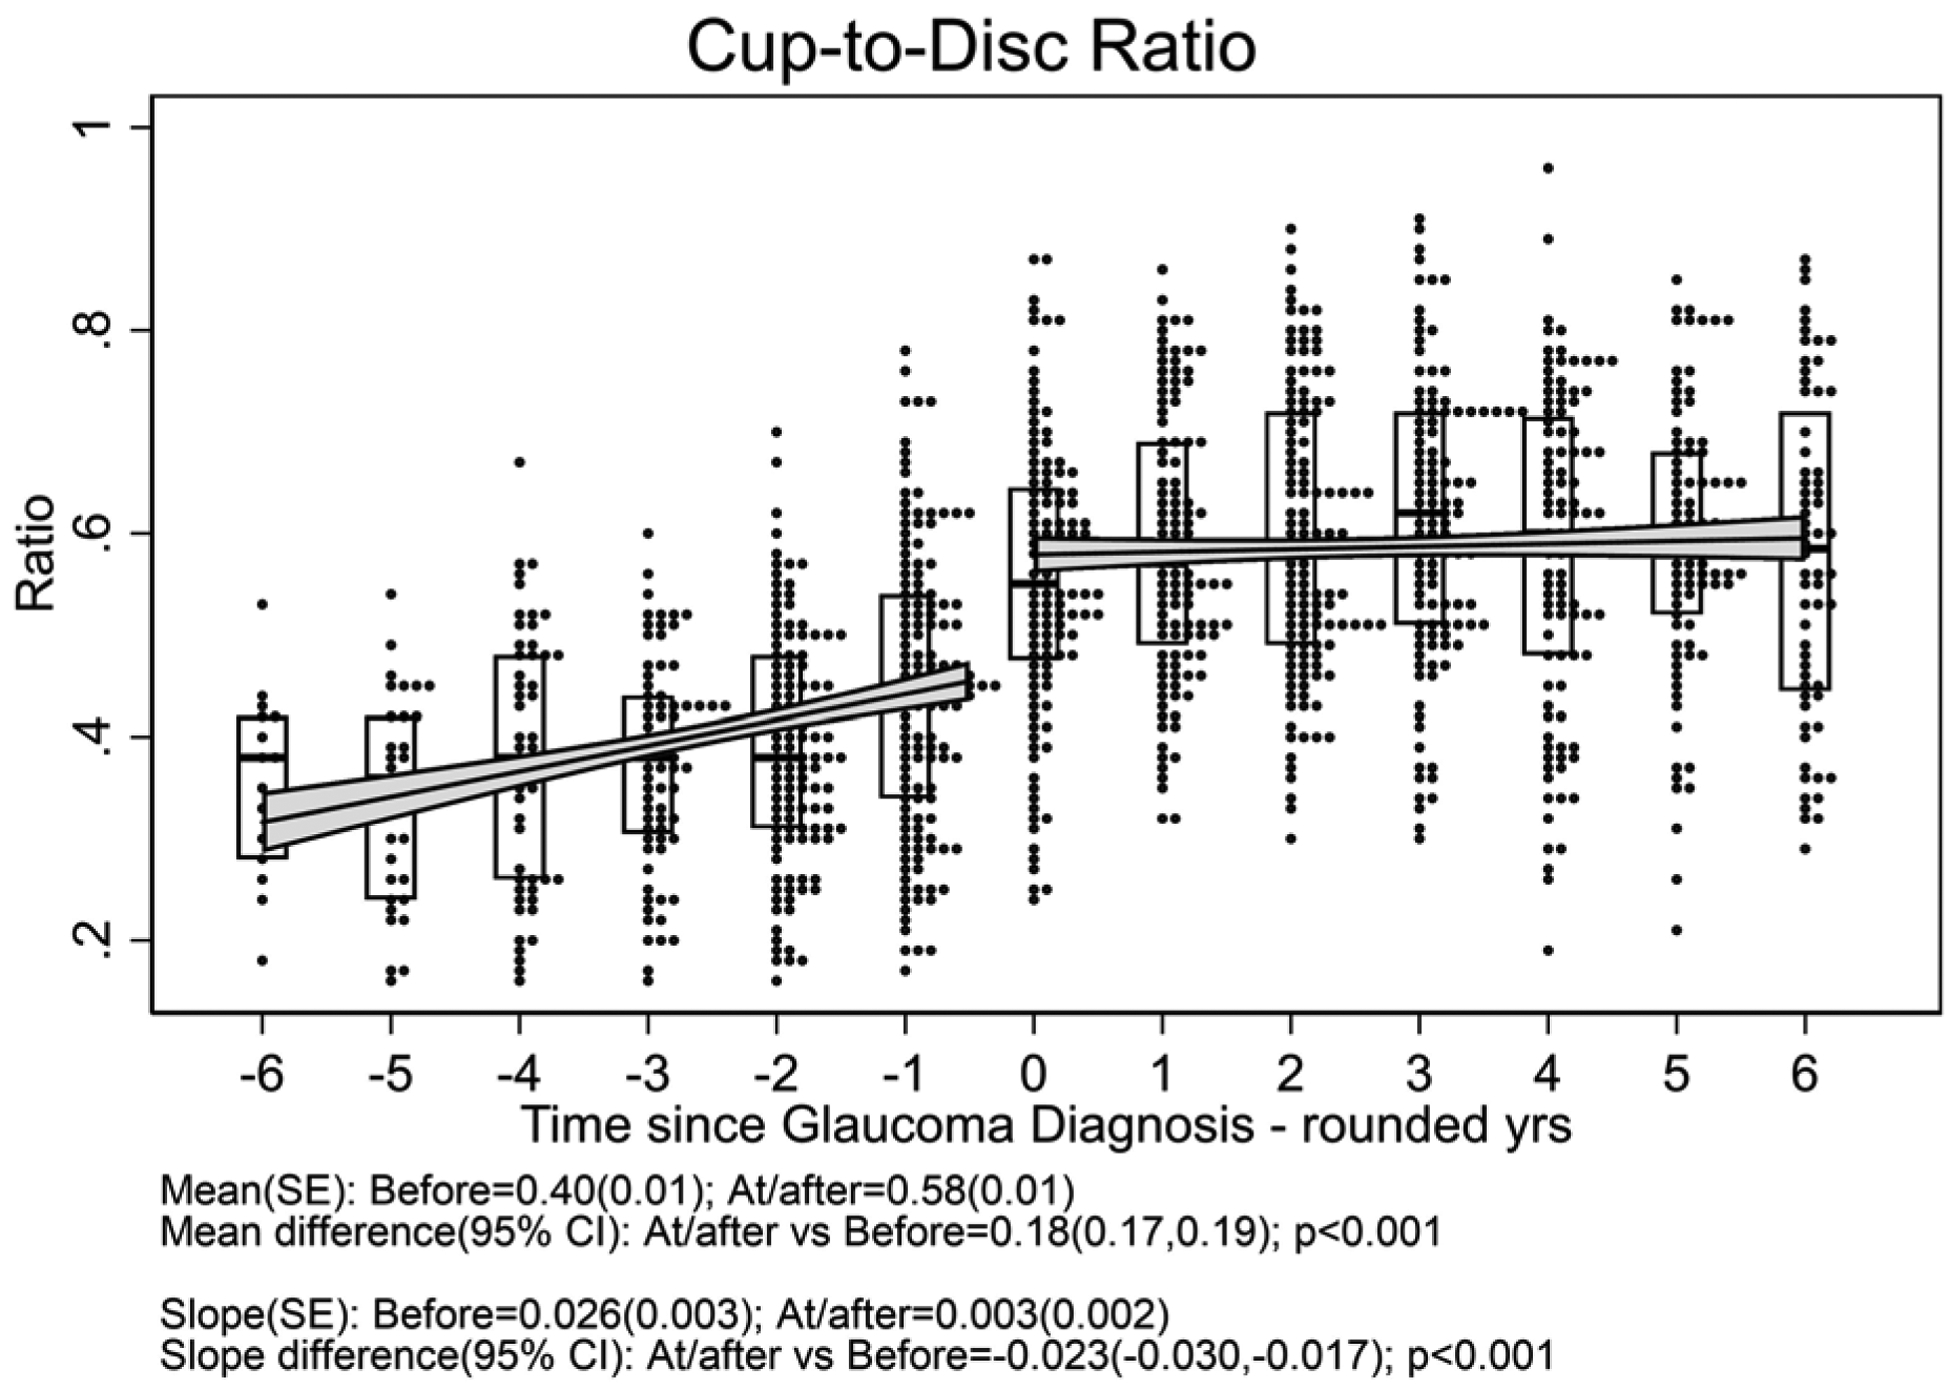
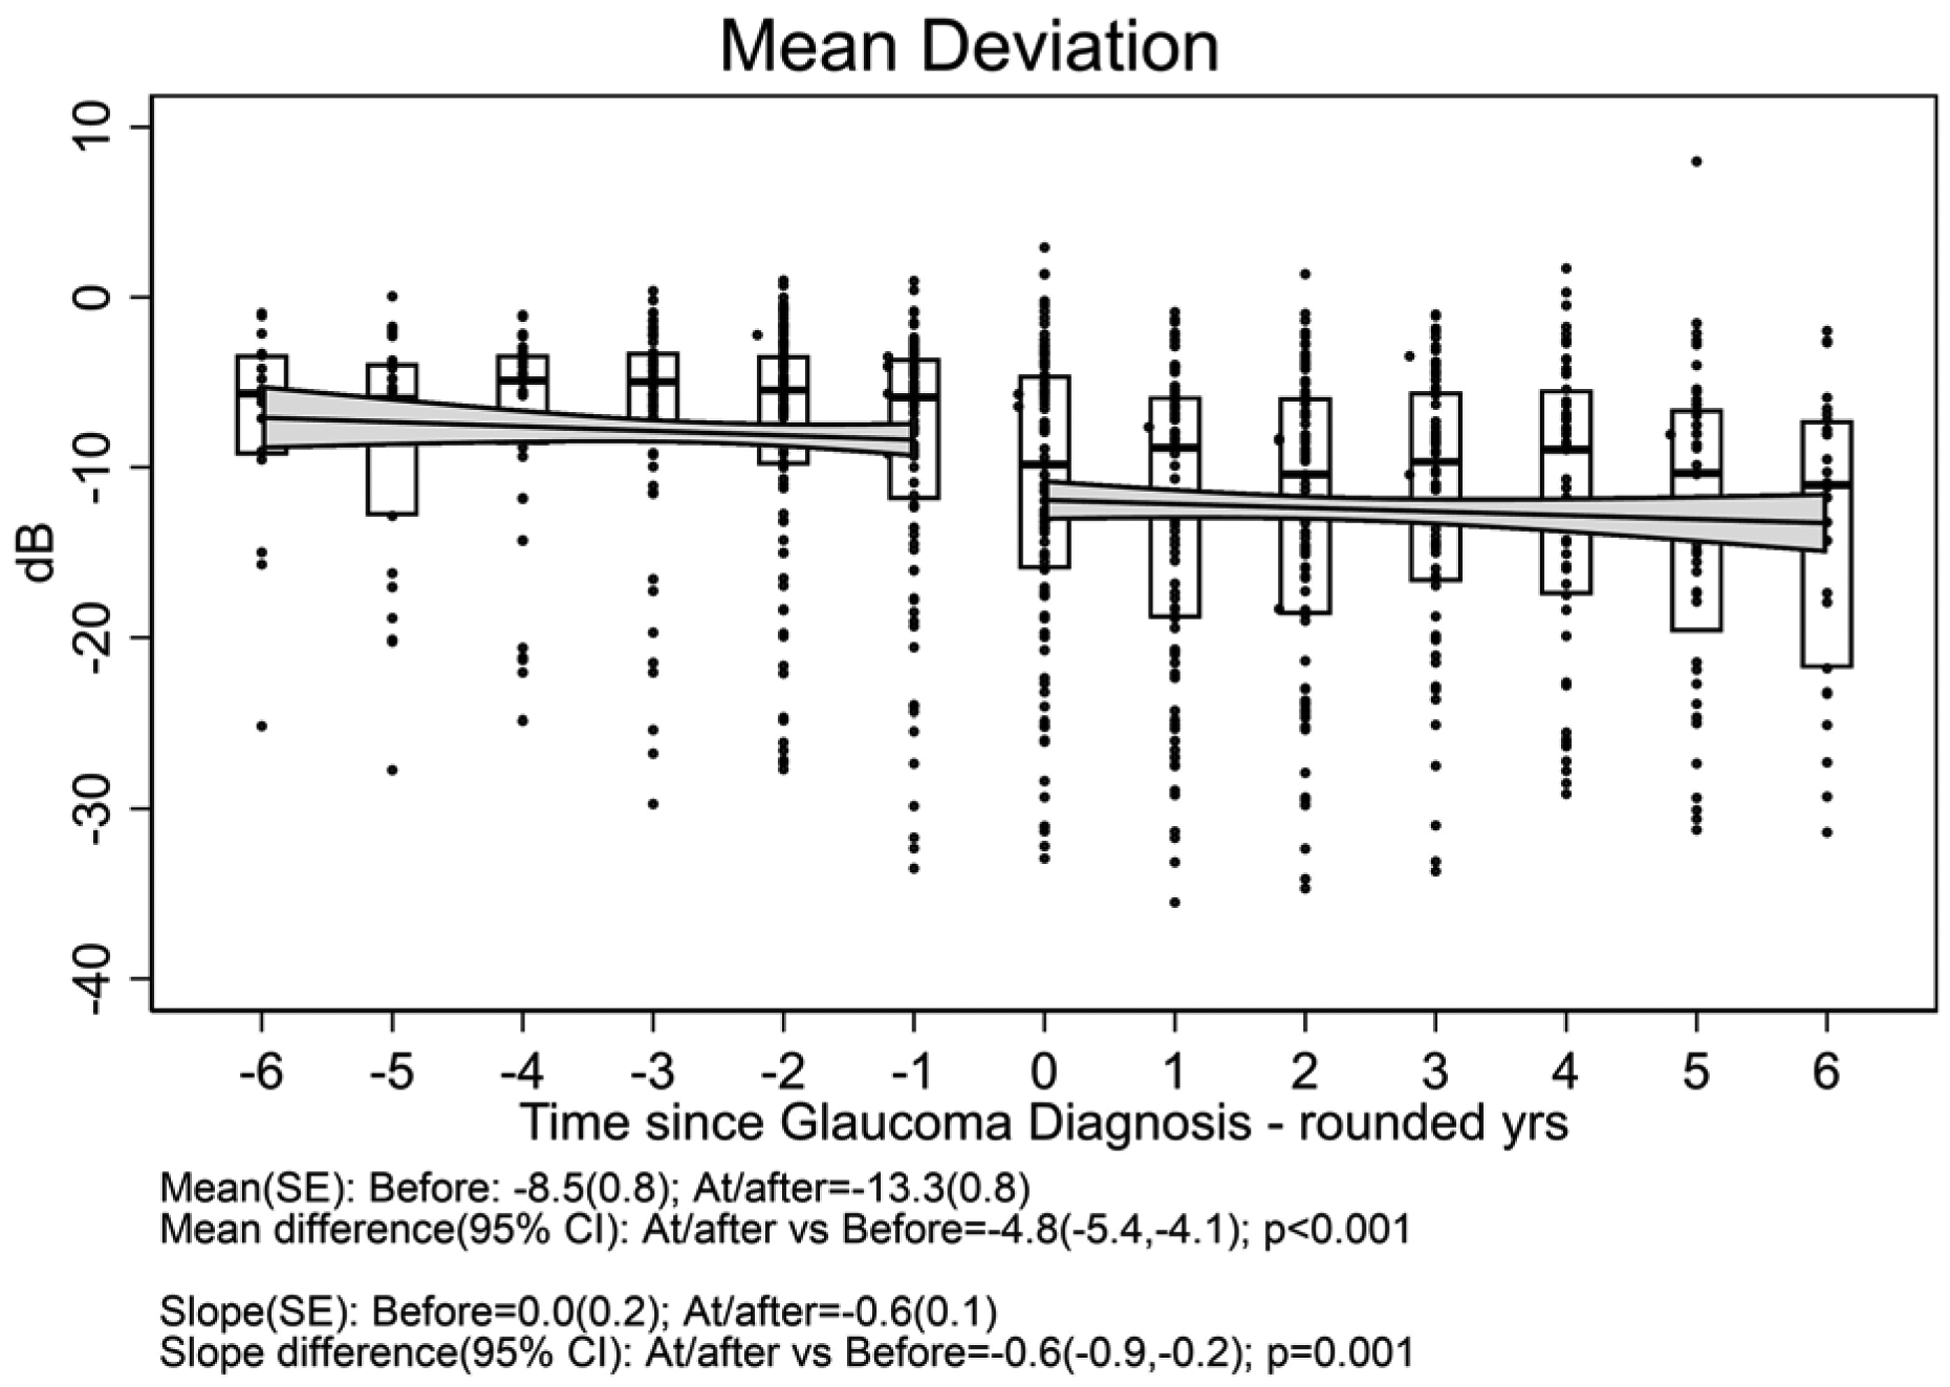
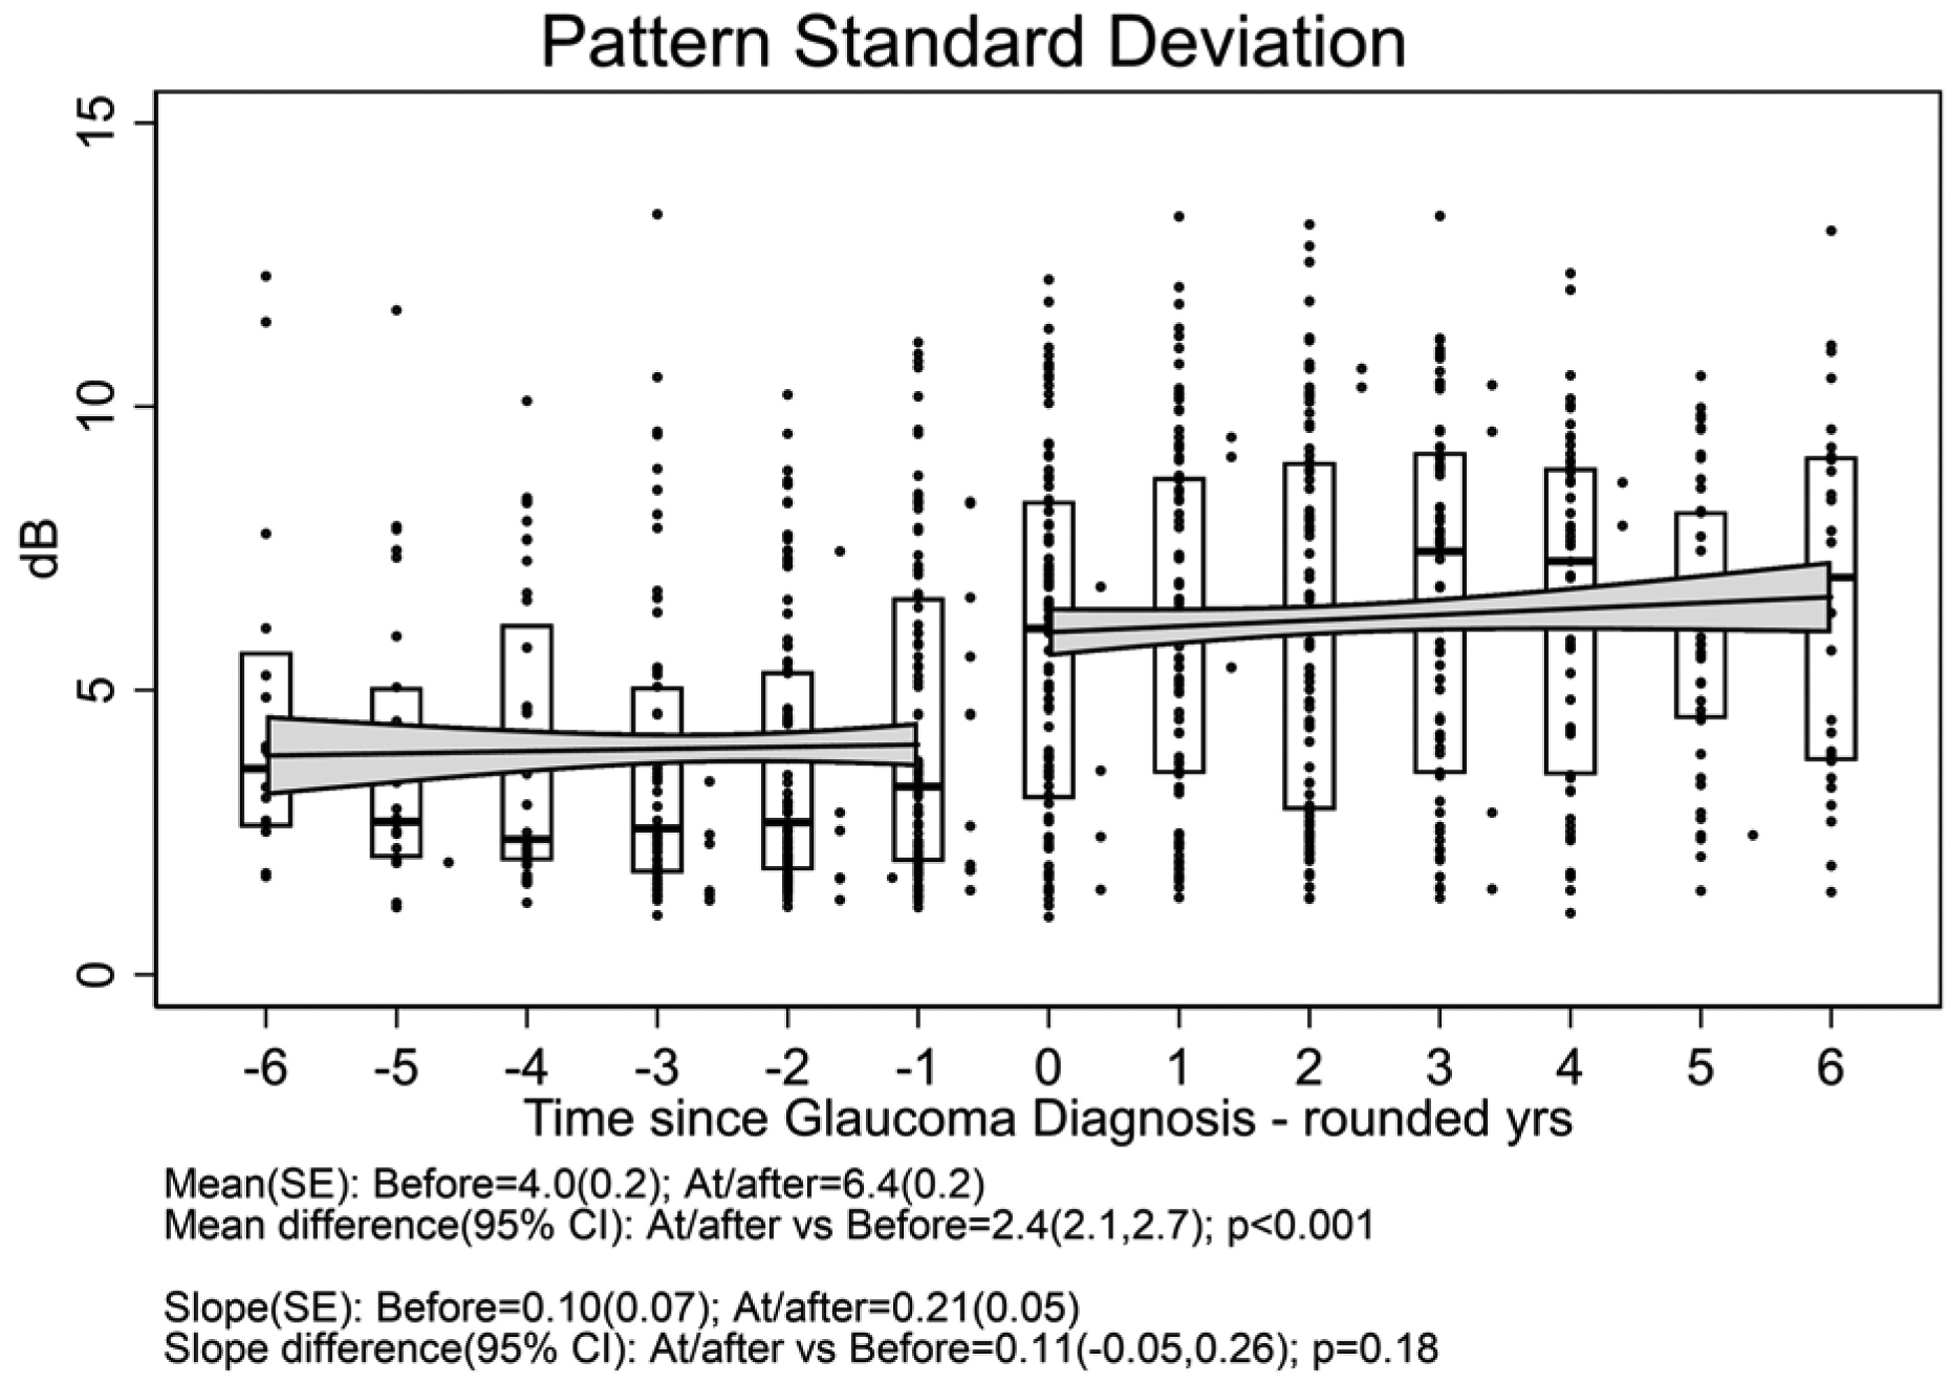
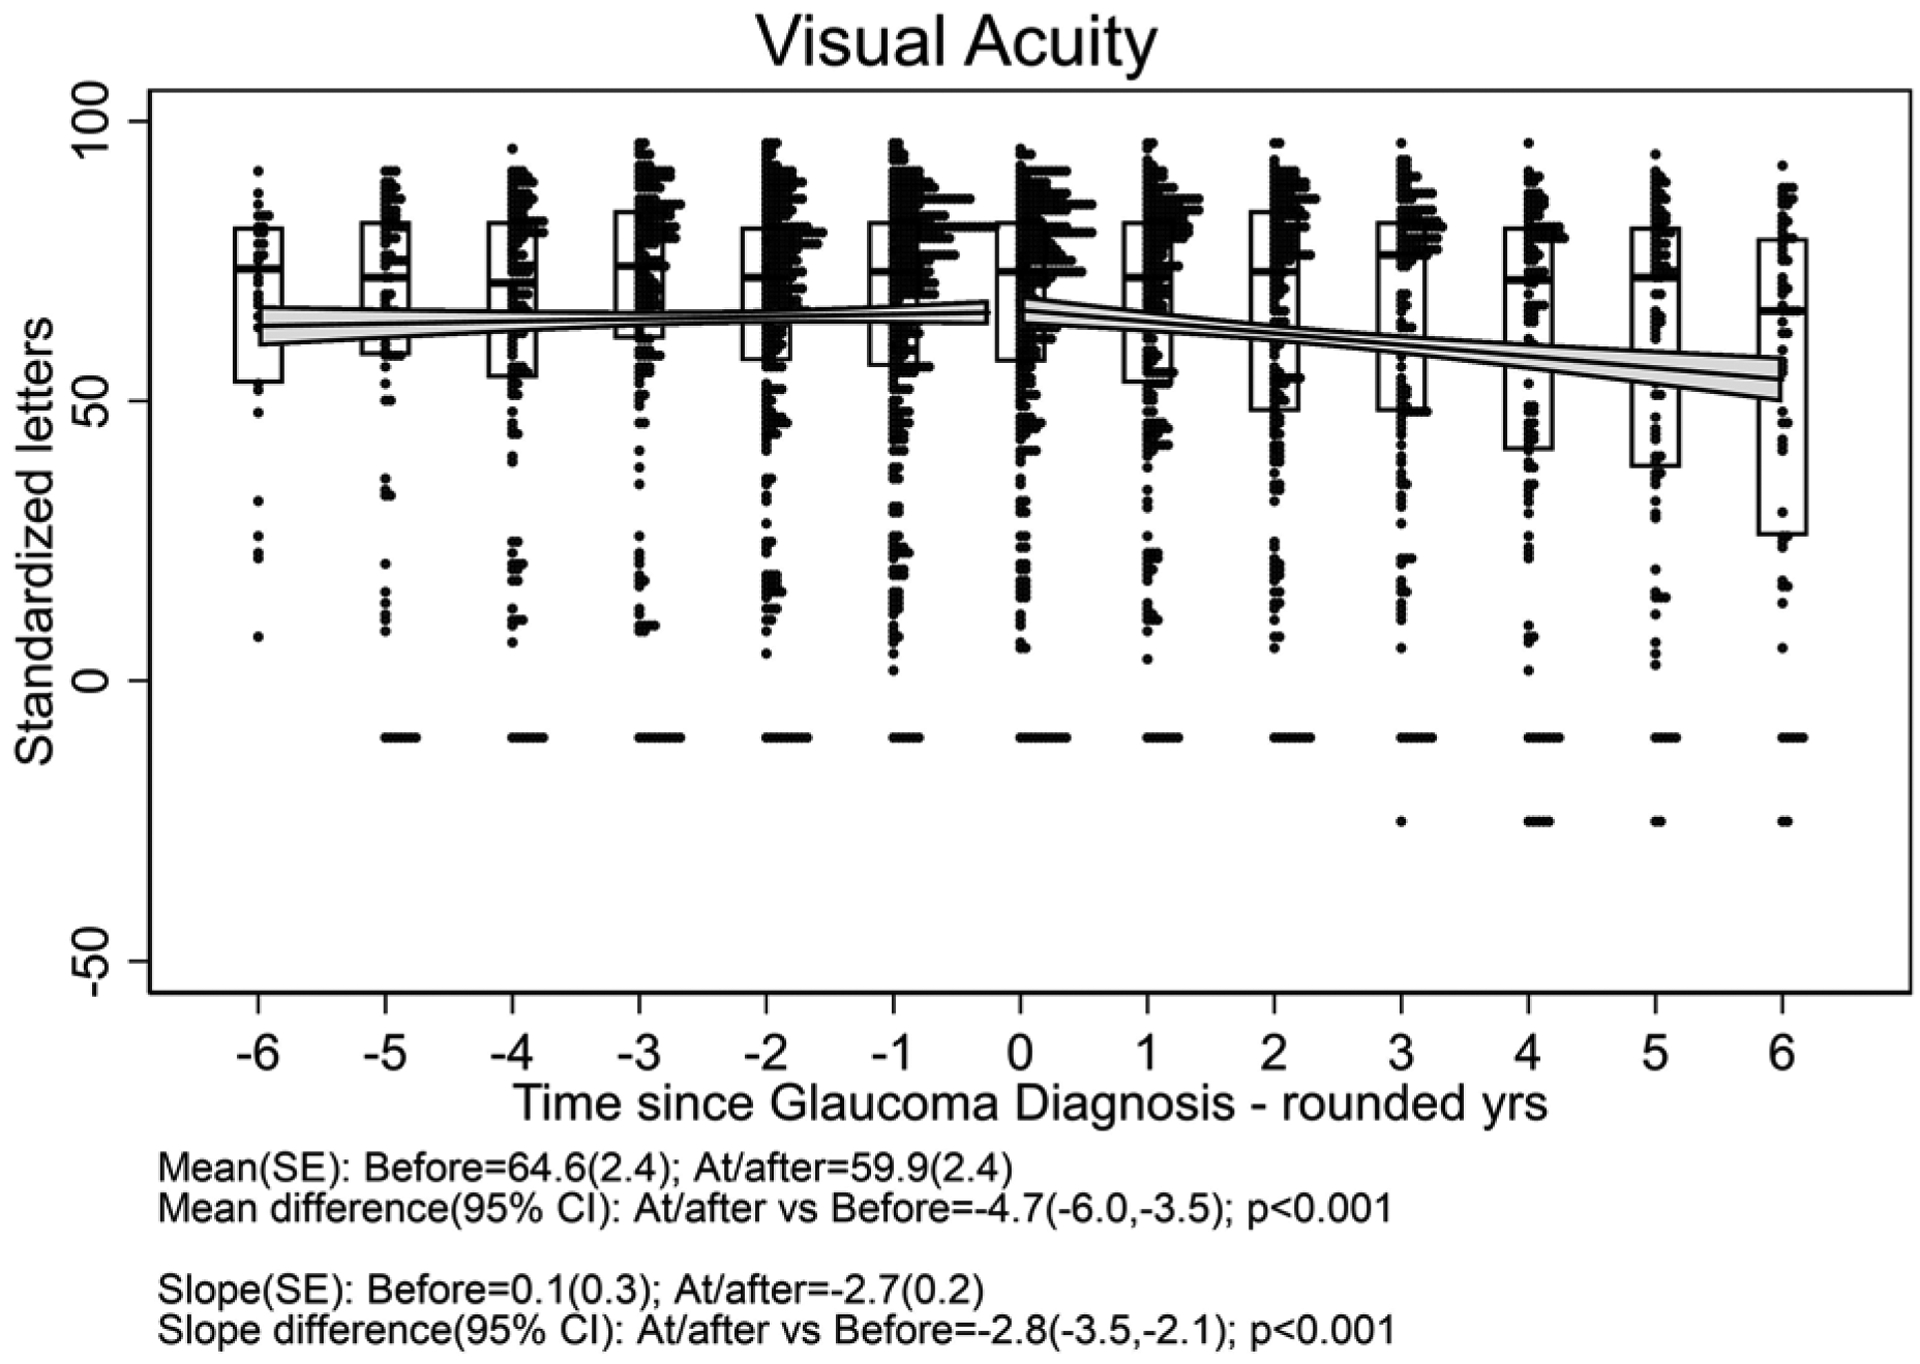
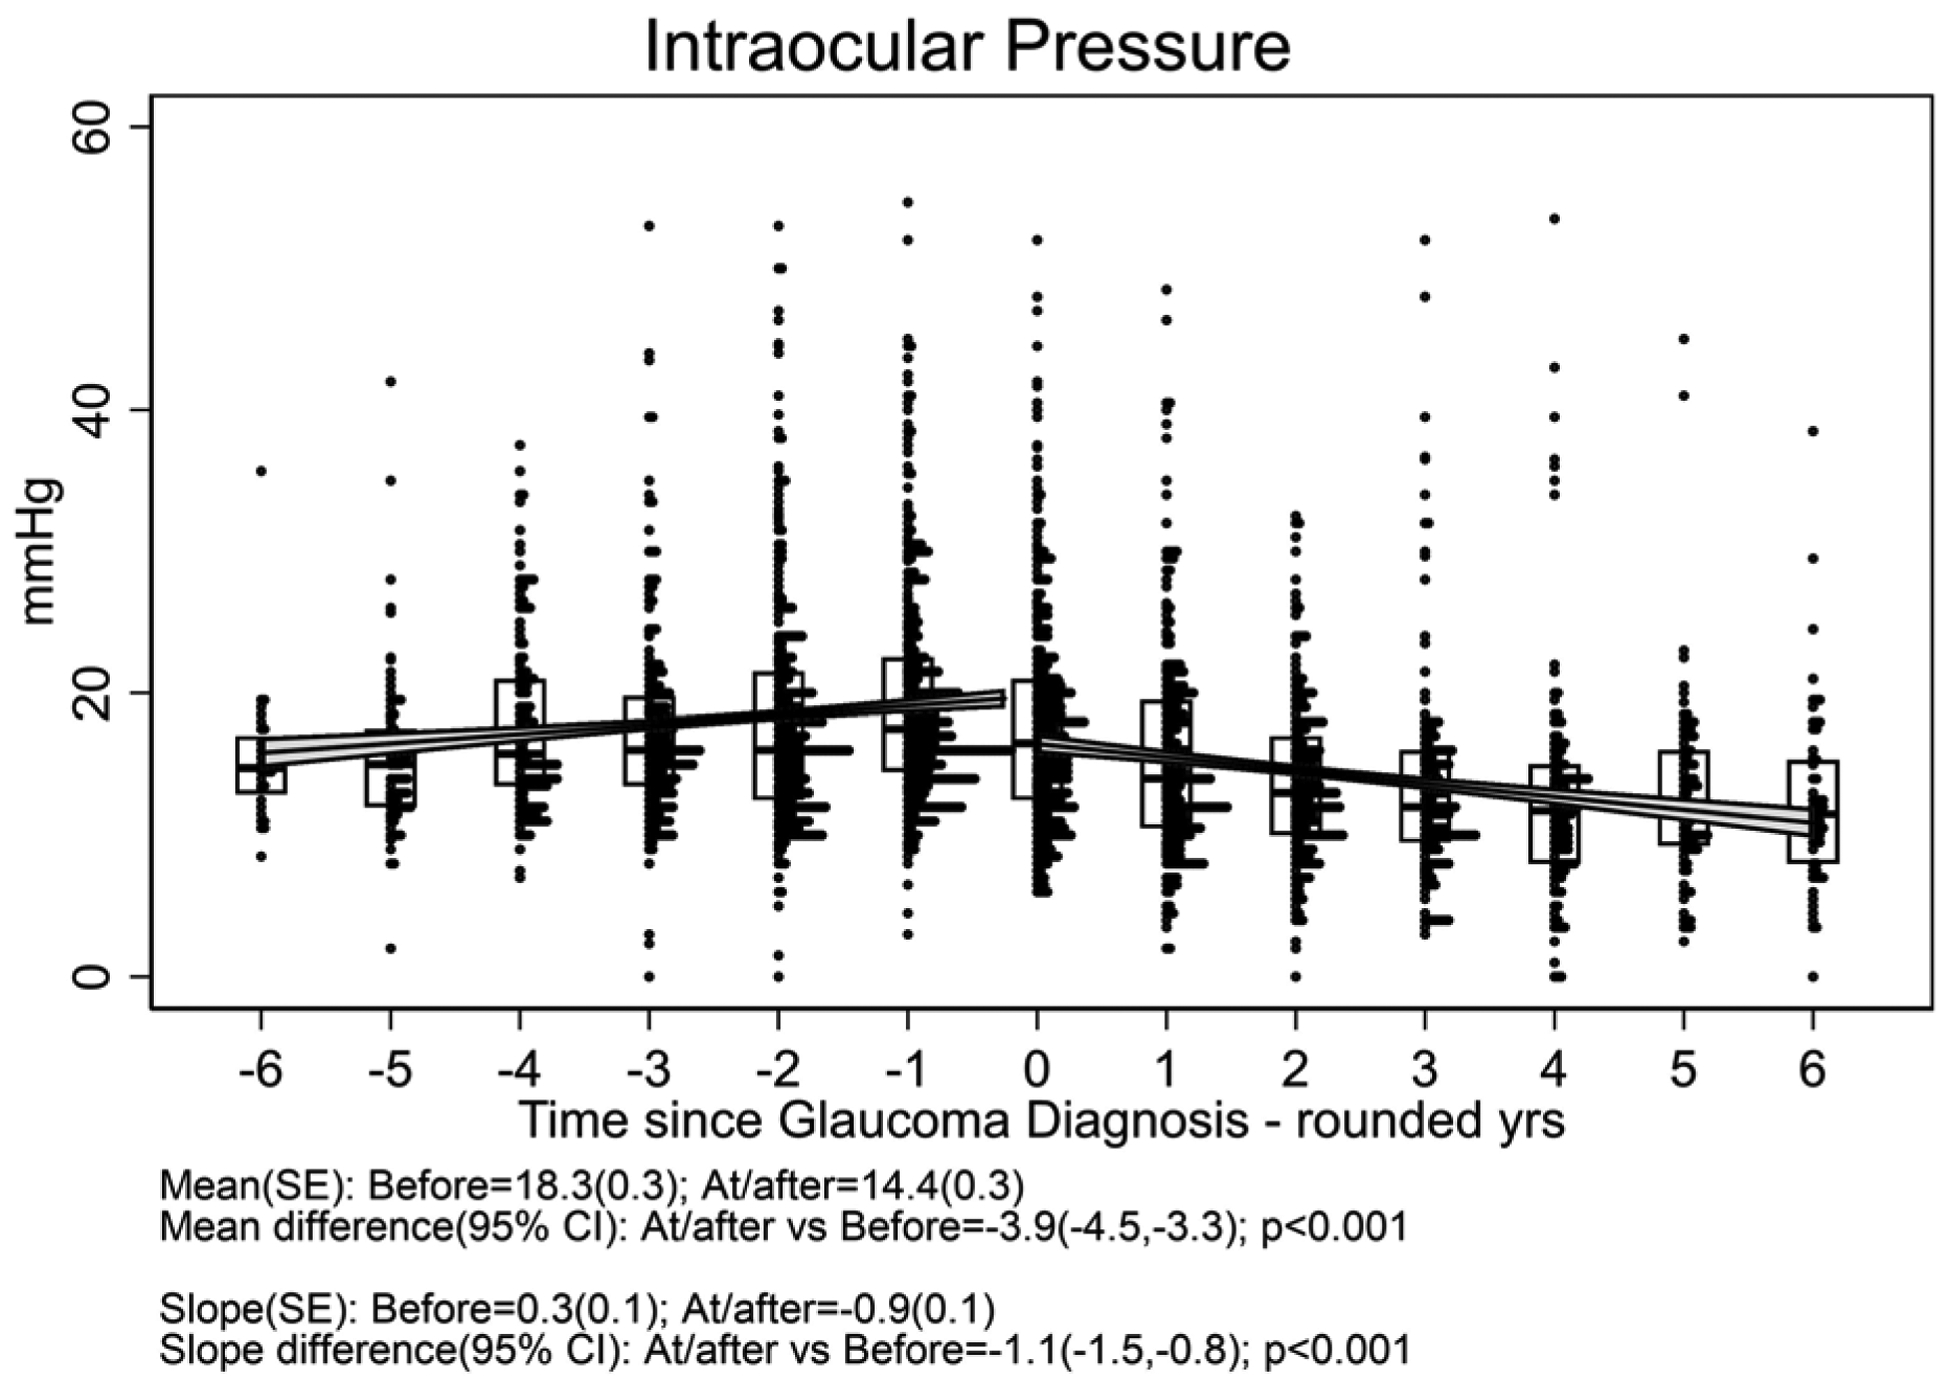
a: Cup-to-disc ratio; b:Mean deviation; c) Pattern standard deviation; d) Best-corrected visual acuity; e) Intraocular pressure. Overall, mean Visual Acuity was worse by approximately five letters (one line) at/after diagnosis with glaucoma compared with before (p<0.001), and the trajectory of change in visual acuity after glaucoma diagnosis was toward worsening by approximately 2.5 letters (one-half line) per year. Overall, mean IOP was worse approximately 4 mmHg lower at/after diagnosis with glaucoma than before (p<0.001), and the trajectory of change in mean IOP was upward before vs. downward after glaucoma diagnosis (p<0.001).
