Figure 1:
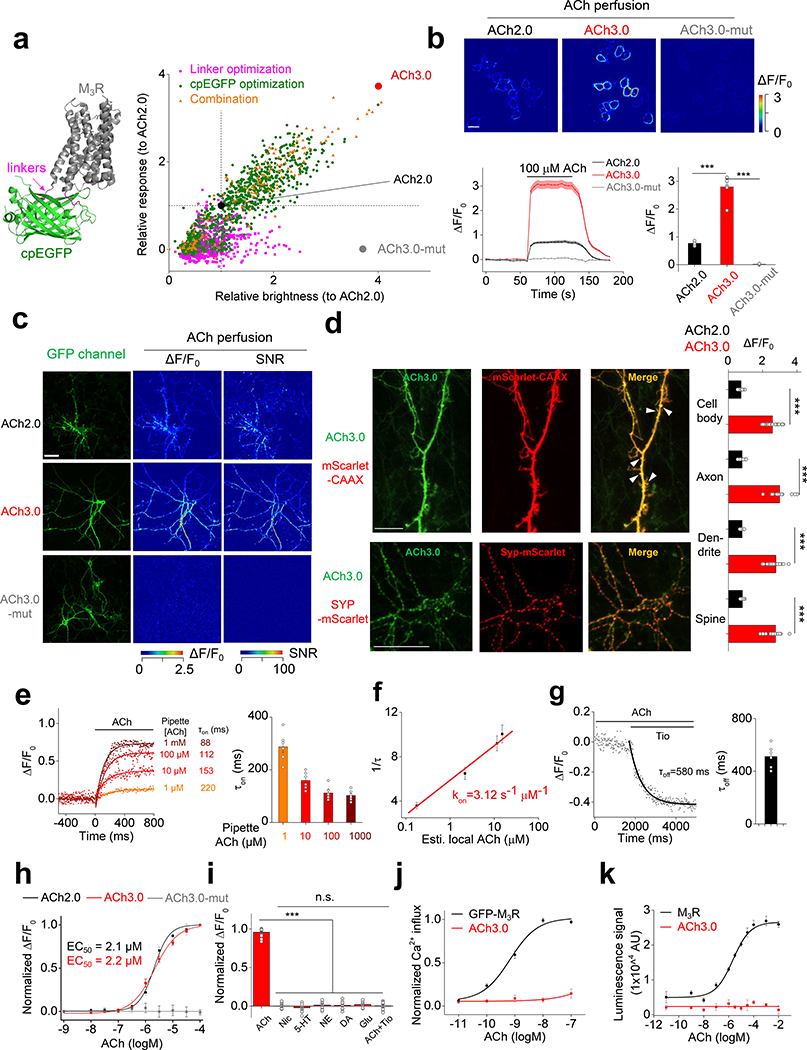
Optimization and in vitro characterization of next-generation GRABACh sensors.
a: Left: cartoon illustration showing the predicted structure of GRABACh sensors. Right: site-directed random mutagenesis is performed in linkers between the receptor and cpEGFP (magenta), cpEGFP (green), or both (orange), and the performance of each variant (relative to ACh2.0, black) is calculated and plotted. The final optimized sensor, ACh3.0 is indicated in red, and the ligand-insensitive ACh3.0-mut sensor (with W200A mutation) is indicated in gray. Each data point represents the average response measured in >100 cells per candidate. The “relative response” is calculated by considering ΔF/F0 of ACh2.0 as 1 and normalizing ΔF/F0 of each candidate to that. The “relative brightness” is calculated similarly. The crystal structures are from the protein database (PDB) archive (PDB ID: 4DAJ for M3R; PDB ID: 3EK4 for cpGFP).
b: The performance of the ACh2.0, ACh3.0, and ACh3.0-mut sensors expressed in HEK293T cells in response to 100 μM ACh upon confocal imaging. Top: pseudocolor images of the peak response (ΔF/F0) in the presence of 100 μM ACh. Bottom: representative traces and group data; n=5, 7, and 4 coverslips for ACh2.0, ACh3.0, and ACh3.0-mut, respectively, with an average of >20 cells per coverslip, p=6.2E-6 for ACh2.0 and ACh3.0; p=9.9E-6 for ACh3.0 and ACh3.0-mut.
c: The performance of the ACh2.0, ACh3.0 and ACh3.0-mut sensors expressed in cultured rat cortical neurons in response to 100 μM ACh. The raw GFP fluorescence and pseudocolor images of the peak response to ACh (ΔF/F0) and signal-to-noise ratio (SNR) are shown. Similar results as the representative images were observed for more than 10 neurons.
d: Left: representative images of ACh3.0 expressed together with synaptophysin (Syp) or CAAX fused to mScarlet. Dendritic spines are indicated by white arrowheads. Right: group data summarizing the fluorescence response of ACh2.0 (black bars) and ACh3.0 (red bars) to 100 μM ACh measured in the indicated neuronal compartments (cell body: n=11 cells for ACh2.0 and n=18 cells for ACh3.0, p=5.1E-14; axon: n=8 cells for ACh2.0 and n=14 cells for ACh3.0, p=2.3E-13; dendrite: n=18 cells for ACh2.0 and n=26 cells for ACh3.0, p=4.6E-15; spine: n=10 cells for ACh2.0 and n=16 cells for ACh3.0, p=1.5E-13).
e: The raising kinetics of ACh3.0 fluorescence signal in HEK293T cells to locally puffed ACh at the indicated concentrations in the puffing pipette. The actual concentrations reaching the cell are calibrated in Extended Data Fig. 3g based on the peak fluorescence response of ACh3.0. Representative traces and group data are shown (n=6 cells for 1 μM ACh; n=6 cells for 10 μM ACh; n=8 cells for 100 μM ACh; n=6 cells for 1000 μM ACh).
f: The association rate constant of the ACh3.0 sensor to ACh. Local ACh concentrations are estimated based on the dose-dependent fluorescence response of ACh3.0 (n=6 cells for 1 μM ACh; n=6 cells for 10 μM ACh; n=8 cells for 100 μM ACh; n=6 cells for 1000 μM ACh; ACh concentrations here indicate those in the puffing pipette).
g: The decay kinetics of the ACh3.0 fluorescence signal when locally puffed with antagonist Tio (10 μM) to cells bathed in ACh (100 μM). Representative traces and group data are shown (n=6 cells from 6 coverslips).
h: Dose-response relations for the fluorescence response of ACh2.0 (black), ACh3.0 (red), and ACh3.0-mut (gray) to ACh, with corresponding EC50 values (n=11,12 and 16 neurons for ACh2.0, ACh3.0 and ACh3.0-mut, respectively).
i: The fluorescence response of ACh3.0 to the indicated compounds (n=12 neurons each). ACh: 100 μM; nicotine (Nic): 50 μM; 5-HT: 1 μM; norepinephrine (NE): 10 μM; dopamine (DA): 20 μM; glutamate (Glu): 10 μM; and tiotropium (Tio): 2 μM, p=3.5E-14; 2.0E-14; 2.3E-14; 7.2E-14; 6.9E-14; 7.5E-14 between ACh and Nic, 5-HT, NE, DA, Glu, ACh+Tio, respectively.
j: The normalized Ca2+ response to ACh in HEK293T cells expressing GFP-M3R or ACh3.0. Each data point is averaged from n=10 cells.
k: The β-arrestin dependent luminescence signal in HEK293T cells expressing GFP-M3R or ACh3.0 in response to ACh at the indicated concentration (n=6 wells in each group, with >100 cells per well).
All data are shown as mean value +/− SEM, with the error bars or shaded regions indicating SEM. Scale bars represent 10 μm, except 20 μm in c. Two-sides Student’s t test performed in (b), (d) and (i); ***p<0.001 and n.s., not significant.

