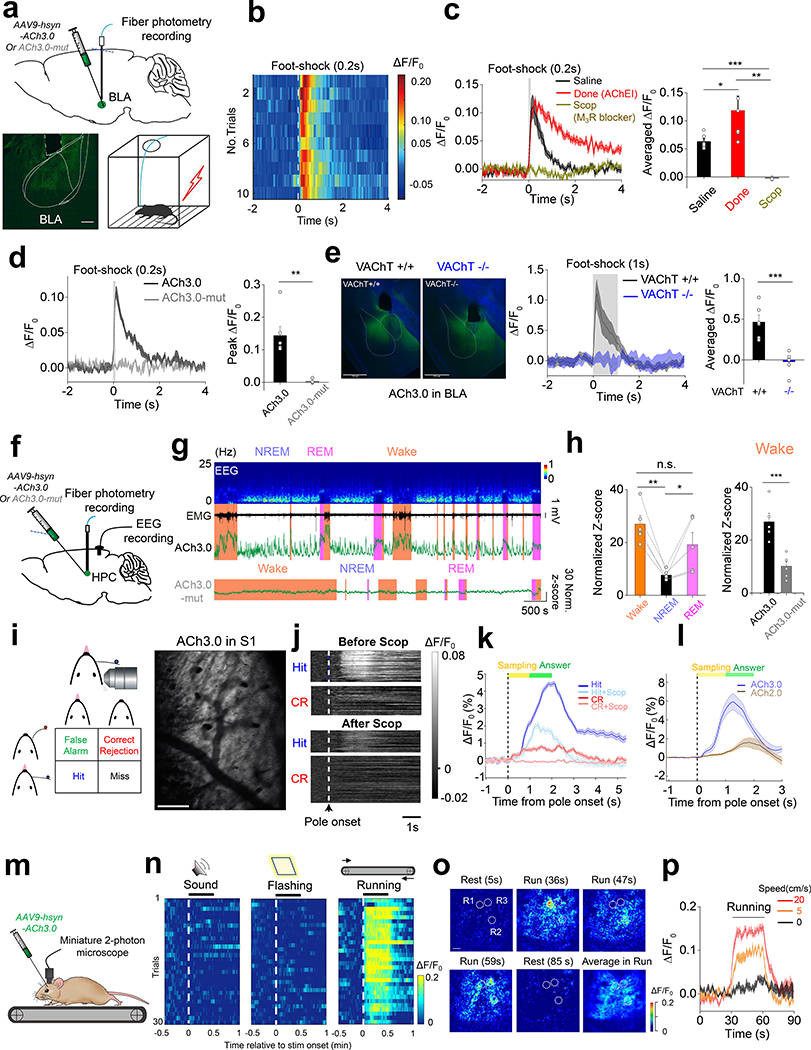
Figure 3: Monitoring in vivo ACh dynamics in mice.
a: Top: schematic diagram depicting the injection of an AAV encoding the ACh3.0 or ACh3.0-mut sensor into the basolateral amygdala (BLA); the fluorescence response is recorded using fiber-photometry. Bottom: fluorescence of the ACh3.0 sensor expressed in the BLA (left) and a cartoon illustration of the foot shock experiments (right).
b: Pseudocolor fluorescence responses of ACh3.0 in the BLA to ten 0.2-s foot-shock stimuli at 0.4 mA. Similar results as the representative result were observed for 6 mice.
c: Representative traces and group summary of the fluorescence response of ACh3.0 in the BLA of mice following an i.p. injection of saline (black), the acetylcholinesterase inhibitor donepezil (Done, red, 3 mg/kg body weight), or the M3R antagonist scopolamine (Scop, gray, 6 mg/kg body weight). The average fluorescence response is calculated using the 1-s mean fluorescence after the initiation of foot shock (n=6 mice per group), p=0.046 between Saline and Done; p=0.0047 between Done and Scop; p=4E-5 between Saline and Scop.
d: Similar to (c), showing the fluorescence response of ACh3.0 and ACh3.0-mut to a 0.2-s foot-shock; n=6 and 4 mice for ACh3.0 and ACh3.0-mut, respectively, p=0.004.
e: Left: fluorescence images of ACh3.0 expressed in the BLA of control mice (VAChT+/+, black) and VAChT forebrain knockout mice (VAChT−/−, blue). Middle and right: representative traces and group summary of the response measured in the BLA of VAChT+/+ and VAChT−/− mice to 1-s foot-shock; n=6 mice per group, p=0.0008. Scale bars represent 750 μm.
f: Schematic diagram depicting the injection of an AAV resulting in the expression of ACh3.0 or ACh3.0-mut into the mouse hippocampus (HPC); fluorescence is recorded in the mice during the sleep-wake cycle. The placement of intracranial EEG recording electrodes is also indicated.
g: Representative recording of EEG, EMG and ACh3.0 (upper) or ACh3.0-mut (bottom) fluorescence response during the sleep-wake cycle. The mouse’s sleep/wake status (wake, NREM sleep, or REM sleep) is determined using the EEG and EMG data and is indicated. The standard deviation of the signal during NREM sleep when there was no apparent fluctuation in the signal is used for normalization to calculate the normalized Z-score (see Methods for detail).
h: Left, group summary of the ACh3.0 fluorescence response (expressed as a normalized Z-score) in mice while awake and during NREM and REM sleep; n=5 mice per group. Right, the comparison of fluorescence response between ACh3.0 and ACh3.0-mut in wake status (n=5 mice for ACh3.0 and n=6 mice for ACh3.0-mut) of mice. P=0.0025 between wake and NREM; p=0.045 between NREM and REM; p=0.19 between wake and REM; p=0.0009 between ACh3.0 and ACh3.0-mut. The comparison of ACh3.0 and ACh3.0-mut in other sleep status is summarized in Extended Data Figure 8.
i: Left, cartoon illustration of the head-fixed whisker-guided object localization task. Right, two-photon imaging of ACh sensors expressed in layer 2 of S1 cortex. Scale bar, 100 μm. Similar results as the representative images were observed for 3 mice.
j: Pseudocolor images showing the representative fluorescence response of ACh3.0 on Hit and Correct Rejection (CR) trials during the task, before and after i.p. injection of scopolamine (Scop, 5mg/kg). Similar results as the representative images were observed for 3 mice.
k: Average fluorescence response of ACh3.0 on Hit and Correct Rejection (CR) trials, before and after scopolamine (Scop) injection (n=3 mice).
l: Average fluorescence response comparing the ACh2.0 or ACh3.0 sensors on Hit trials (n=3 mice per group).
m: Schematic illustration depicting the experiment in which mice expressing ACh3.0 in the visual cortex are placed on a treadmill and ACh3.0 fluorescence is recorded using the miniature two-photon microscope.
n: Pseudocolor fluorescence responses of ACh3.0 to an auditory stimulus (30 s of a 7000-Hz tone, left), a visual stimulus (30-s of flashing light at 2 Hz, middle), or running on the treadmill (right). The responses of 30 consecutive trials are recorded and are plotted relative to the onset of each stimulus.
o: Pseudocolor images showing the spatial-temporal distribution of ACh3.0 fluorescence during locomotion from a single trial. R1, R2 and R3 are three representative ROIs (40 μm in diameter) indicating spatially selective ACh signals at indicated time point during running. The averaged fluorescent signal during entire running process is also shown. Scale bar, 50 μm. Similar results as the representative images were observed for 5 mice.
p: Representative traces of ACh3.0 fluorescence in mice recorded while running on a treadmill at the indicated speeds; each trace is averaged from 10 trials.
All data are shown as mean value +/− SEM, with the error bars or shaded regions indicating SEM.
Two-sides Student’s t test performed in (c), (d), (e) and (h); *p<0.05, **p<0.01, ***p<0.001, and n.s., not significant.

