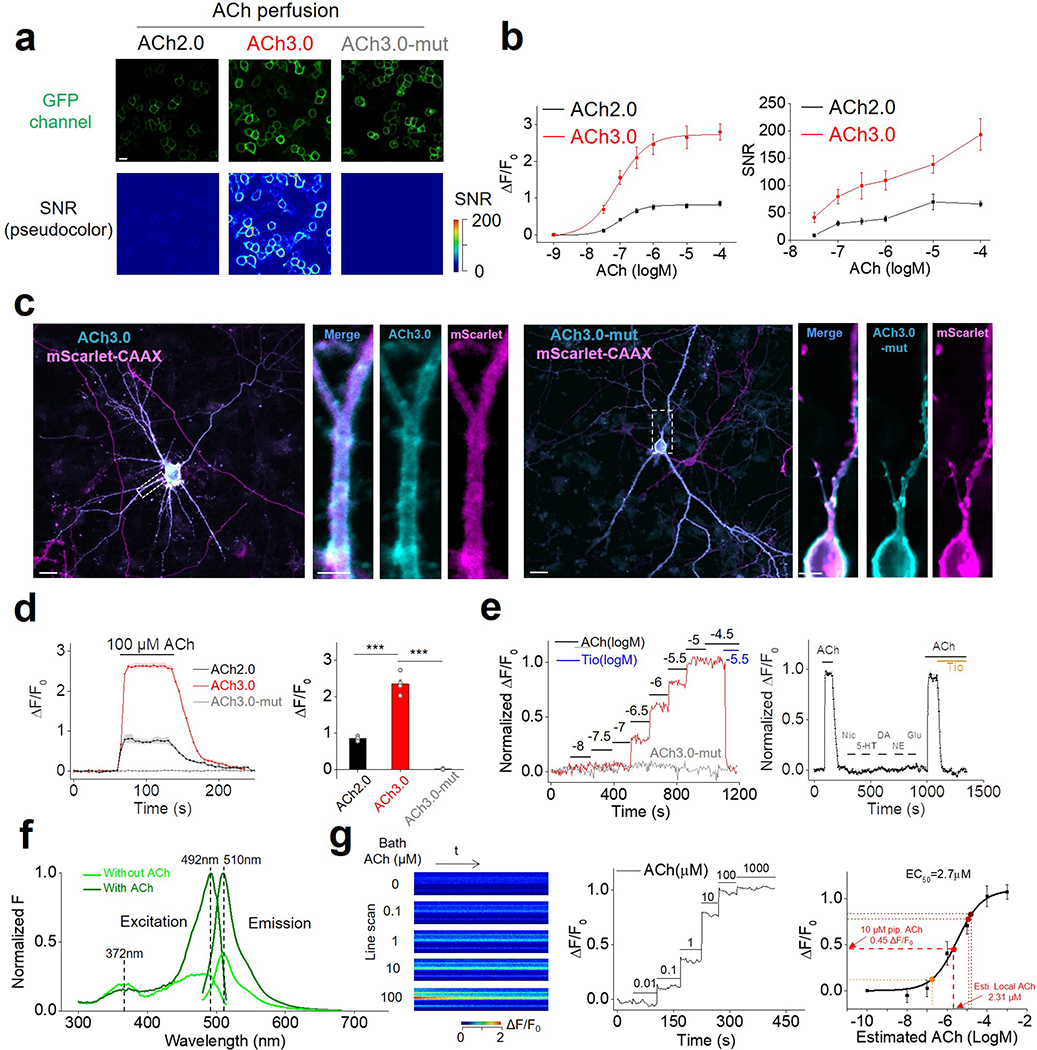
Extended Data Fig. 3. Characterization of ACh2.0 and ACh3.0.
a: The fluorescence response of ACh2.0, ACh3.0, and ACh3.0-mut to 100 μM ACh in HEK293T cells. The fluorescence images are shown on top, and corresponding pseudocolor images representing the signal-to-noise ratio (SNR) are shown at the bottom. Similar results as the representative images were observed for more than 7 cells. Scale bars represent 10 μm.
b: The peak fluorescence response (ΔF/F0, left) and SNR (right) of ACh2.0 (black) and ACh3.0 (red) are measured with the indicated concentrations of ACh; n=8 and 7 cells for ACh2.0 and ACh3.0, respectively.
c: Example fluorescence images of ACh3.0 (left) and ACh3.0-mut (right) expressed in cultured rat cortical neurons. Membrane-targeted mScarlet-CAAX is coexpressed and used to confirm expression at the plasma membrane. Similar results as the representative images were observed for more than 5 neurons. Scale bars represent 10 μm in the original image and 5 μm in the magnified images.
d: Representative traces (left) and group summary (right) of the fluorescence response of ACh2.0, ACh3.0, and ACh3.0-mut expressed in cultured neurons; where indicated, 100 μM ACh is applied to the cells (n=4, 5, and 7 neurons for ACh2.0, ACh3.0, and ACh3.0-mut, respectively), p=9.45E-5 between ACh2.0 and ACh3.0; p=6.42E-5 between ACh3.0 and ACh3.0-mut.
e: Left, representative traces of the normalized fluorescence change in ACh3.0 (red) and ACh3.0-mut (gray) in response to application of the indicated concentrations of ACh. Note that the ACh-induced fluorescence response in ACh3.0 is blocked by the M3R antagonist tiotropium (Tio, 3 μM). Right, representative trace of the normalized fluorescence change in ACh3.0 in response to indicated compounds. ACh: 100 μM; nicotine (Nic): 50 μM; 5-HT: 1 μM; norepinephrine (NE): 10 μM; dopamine (DA): 20 μM; glutamate (Glu): 10 μM; and Tio: 2 μM. Similar results as the representative images were observed for more than 5 neurons.
f: The excitation and emission spectra of ACh3.0 sensor in the absence (light green) and presence of ACh (100 μM, dark green).
g: Left, pseudocolor images showing the fluorescence response of ACh3.0 in confocal line scanning mode, with indicated concentrations of ACh applied by bath application. Middle, exemplar fluorescence response trace of ACh3.0 to different concentrations of ACh applied. Right, group data of the ACh3.0 dose-dependent fluorescence response in line scanning mode (from n=4 coverslips), which is used to estimate the local ACh concentration reaching the cells during kinetics experiments. The steady-state fluorescence response of ACh3.0 to puffed ACh are shown and calibrated based on the curve, with the detail numbers of 10 μM pipette ACh list as an example (pipette short as pip.; Estimated short as Esti.)
All data are shown as mean value +/− SEM, with the error bars or shaded regions indicating SEM. Two-sides Student’s t test performed in (d); ***p<0.001.

