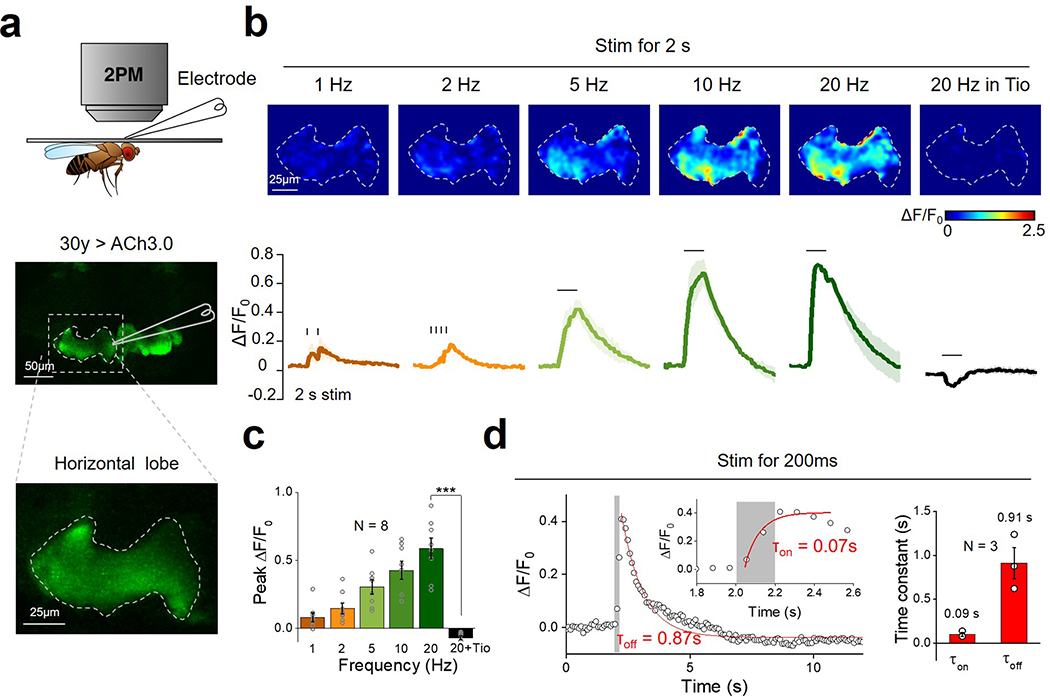
Extended Data Fig. 6. Monitoring in vivo Ach release induced by electrical stimulation in Drosophila.
a: Schematic illustration depicting the experiment in which a transgenic fly expressing ACh3.0 in the KC cells in the mushroom body is placed under a two-photon microscope, and a glass electrode is placed near the mushroom body and used to deliver electrical stimuli. The fly brain is bathed in AHLS containing 100 μM nicotinic acetylcholine receptor blocker mecamylamine (Meca).
b: Pseudocolor images (top) and representative traces (bottom) of the fluorescence change in ACh3.0 in response to 2 s of electrical stimulation at the indicated frequencies. Where indicated, the M3R antagonist tiotropium (Tio, 10 μM) is applied to the bath solution. Similar results as the representative images were observed for 8 flies.
c: Group summary of the data shown in panel (b); n=8 flies, p=0.0004.
d: ACh3.0 fluorescence is measured before and after a 200-ms electrical stimulation, and the rise and decay phases are fitted with a single-exponential function; the time constants are indicated and summarized on the right; n=3 flies.
All data are shown as mean value +/− SEM, with the error bars or shaded regions indicating SEM. Two-sides Student’s t test performed in (c); ***p<0.001.

