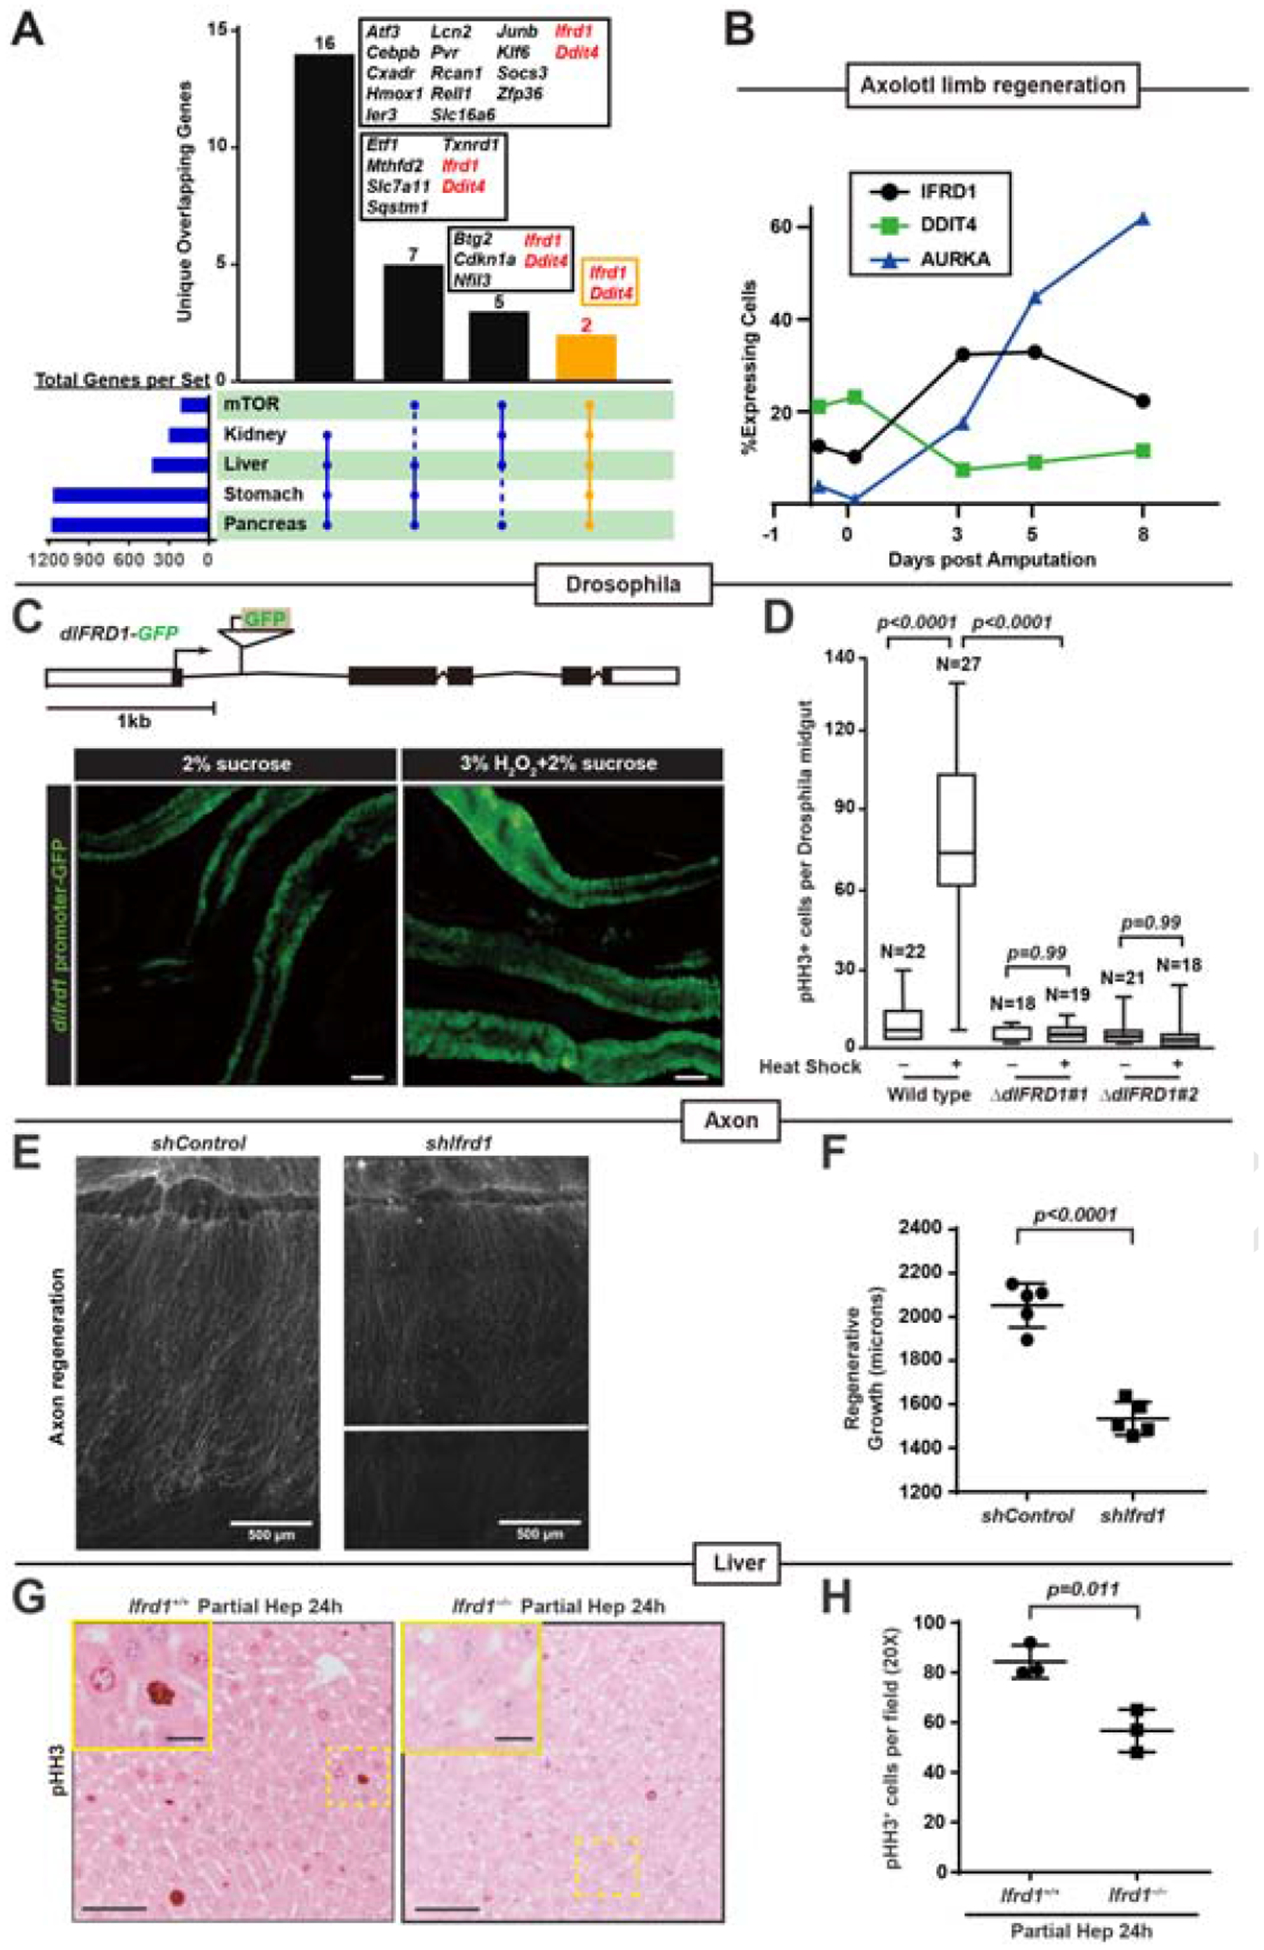
Fig. 1. IFRD1 and DDIT4 are mTORC1-associated genes induced during paligenosis, and IFRD1 is required for paligenosis in multiple tissues and species.

A. Intersection of transcripts upregulated by paligenotic injury in 4 organs with genes in the HALLMARK_MTORC1_SIGNALING Gene Set from Broad GSEA. Only intersections of gene sets ≥4 and transcripts unique for that intersection intersections are depicted.
B. Fraction of cells expressing DDIT4 and IFRD1 in previously published single-cell RNA-sequencing of regenerating cells after axolotl limb amputation. AURKA is representative of a cohort of cell cycle transcripts upregulated at ≈ paligenosis Stage 3.
C. GFP under regulation of difrd1 promoter in Drosophila melanogaster intestine at baseline and after stem-cell recruiting oxidative stress. Scale bar, 100μm. Above: genomic map of GFP P-element insertion in difrd1 locus.
D. Total phospho-Histone H3+ (pHH3+) cells of Wild type untreated (n=22), Wild type with heat shock (n=27), ΔdIFRD1 #1 untreated (n=18), ΔdIFRD1 #1 with heat shock (n=19), ΔdIFRD1 #2 untreated (n=21) and ΔdIFRD1 #2 with heat shock (n=18) Drosophila mid-gut. ΔdIFRD1 #1 and #2 are difrd1 hypomorphic alleles. Variance plotted as mean±SD with significance estimated by one-way ANOVA with Dunnett post-hoc test to the Ifrd+/+ control.
E. Regenerating mouse dorsal root ganglion neurites visualized by anti-SCG10 following axotomy ex vivo of control and shRNA knockdown of Ifrd1 (shIfrd1). Panels are divided at maximal extension of neurite regeneration. Scale bar, 500μm.
F. Axon regeneration quantified following axotomy from Ifrd1+/+ (n=5) and Ifrd1–/– (n=5) mice. Each datapoint: Mean±SEM maximal axon regeneration length for an individual culture from an individual mouse with significance estimated by unpaired, two-tailed t-test.
G. Immunohistochemical staining for mitotic marker pHH3 in regenerating liver 24 hours following partial resection (“Partial Hep”). Scale bar, 50μm; boxed area insert, 25μm.
H. Quantification of data as for panel (G) from Ifrd1+/+ (n=3) and Ifrd1–/– mice (n=3). Each datapoint: Mean±SEM counts of ≥10 fields in a single mouse with significance estimated by unpaired, two-tailed t-test.
