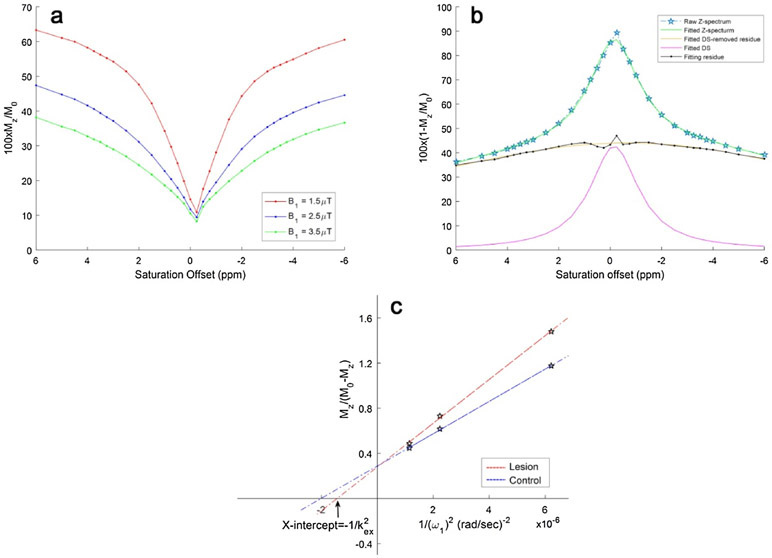
Fig. 1.
Direct saturation removed Omega plots for the quantification of kex. a Typical Z-spectra of infarct brain tissues plotted form −6 to 6 ppm for three different saturation powers B1s (1.5, 2.5, 3.5 μT). b The process of removing water DS by Lorentzian fitting is demonstrated with a Z-spectrum at 1.5 μT. DS was subtracted from the entire Z-spectrum and the residual signals were used for constructing the omega plot. c Typical DS-removed omega plots of infarct (red line) and control brain tissue (blue line). The plots were linear, and the X-intercept of the omega plots provided a direct readout of the exchange rates of infarct or healthy brain tissues.

