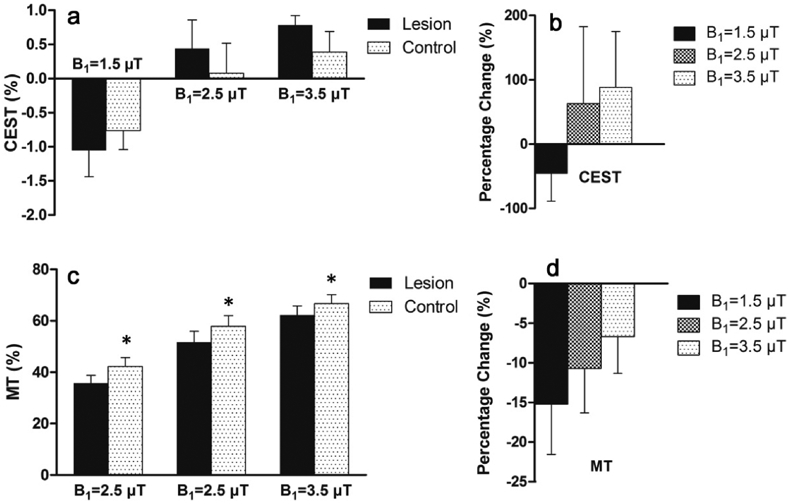
Fig. 5.

CEST/MT contrasts of infarct lesions varied with saturation amplitude B1. a ompared to healthy brain tissues, CEST contrast of lesions was reduced at 1.5 μT, but increased at 2.5 or 3.5 μT, confirmed by the percentage changes between lesions and healthy tissues as shown in Figure b. Figure c shows MT of lesions was consistently reduced, however, at decreased degrees with higher B1 as shown in Figure d. * represents significant differences (P < 0.05) between infarct lesions and control brain tissues for MT.
