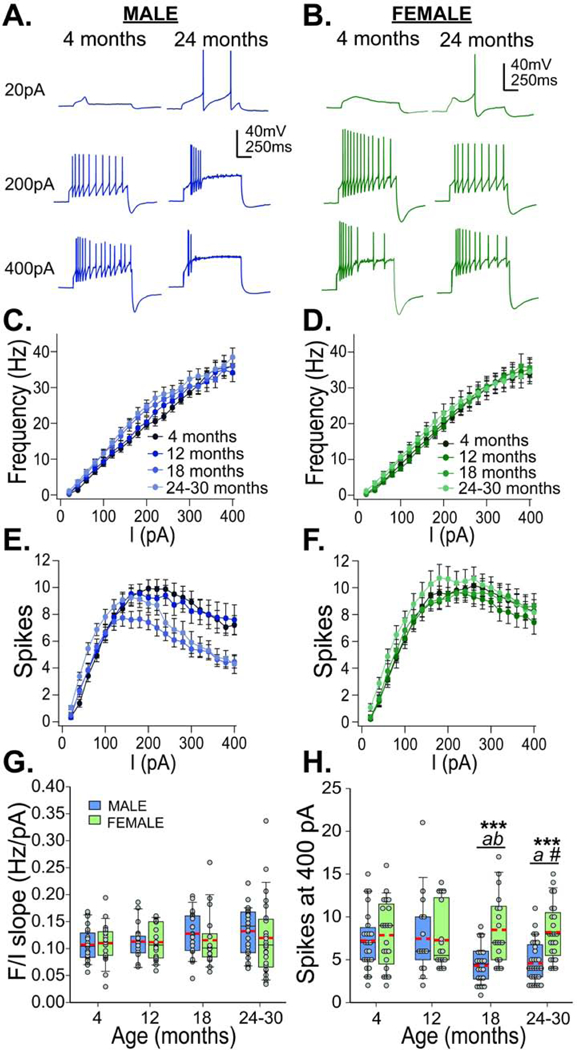
Figure 3.

Membrane excitability across ages. Representative traces of current step injections at 20, 200, and 400 pA from males (A; blue; 4 months left, 24 months right) and females (B; green; 4 months left, 24 months right). F-I curves (frequency x injected current) and number of spikes x injected current are plotted for each age group of males (C. & E., blue, left) and females (D. & F., green, right). Box and whisker plots show slopes of F/I curve (G) and number of spikes at 400 pA current injection (H) across ages in males (blue) and females (green). Red dashed lines show means. Bonferroni corrected t-test: *** males and females differ, p<0.001; a – 18 and 24 month males differ from 12 month males, p<0.05; b – 18 month males differ from 4 month males, p<0.05; # − 24 month males versus 4 month males, p=0.057
