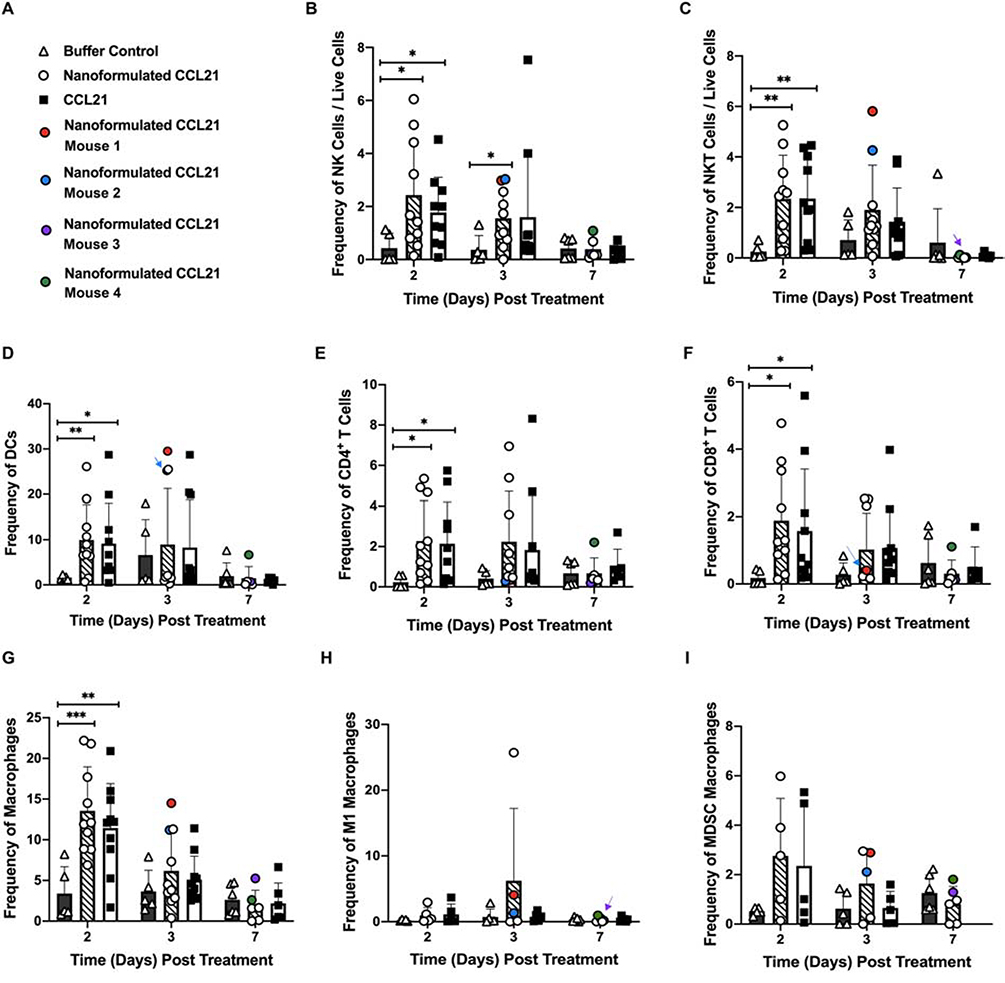
Figure 11.
Comparisons of intratumoral immune cell subset frequencies across treatment groups over time are shown, with the mice that underwent complete regression during this experiment highlighted in color (the coding key is shown in A). Neuro2a tumor-bearing mice received 2 daily intratumoral injections (1 in a.m.; 1 in p.m.) for 2 days in a row with each injection having 6 μg of CCL21/25 μL, or 6 μg of CCL21 in nanoformulation/25 μL per dose, or an equal volume (25 μL) of buffer. Frequency was calculated as % marker = (number of cells that were marker positive) / (number of live cells) X 100. Graphical representation of the data depicts the mean frequency overlaid with individual data points for each group. Statistical comparisons were made via two-way ANOVA. The bars indicate standard deviation. Statistical significance was defined as p < 0.05*, p < 0.01**, and p < 0.001***. Groups consisted of 5–10 mice per treatment group per time point. The data shown in Fig. 11B and Fig. 11C are the same as that shown in Fig. 10 except that color coding has been added to Fig. 11B/C to indicate the NK and NKT intratumoral infiltration for specific mice.

