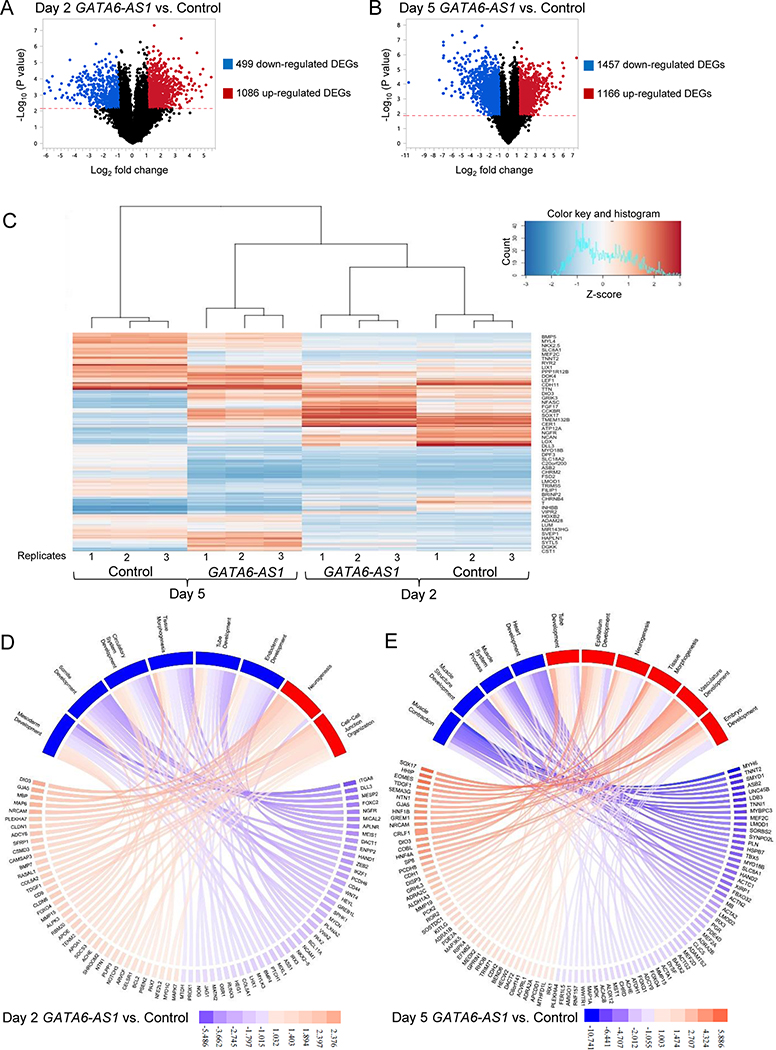
Figure 5. Differential gene expression in day 2 and day 5 samples from the GATA6-AS1 knockdown culture compared with those from the control shRNA culture.
(A, B) Volcano plot portrays log2 fold change of the GATA6-AS1 knockdown samples vs. the control shRNA samples on day 2 and day 5. The grey dots signify genes that were above the -log10(p-value) calculated using a False Discovery Rate [-log10(p-value)>2.173 on day 2 and -log10(p-value)>1.891 on day 5] with log2 fold changes of >1 or <−1. (C) Heatmap showing the expression of the top 100 differentially expressed genes across all 12 samples. (D, E) Pathway plots of significantly downregulated and upregulated pathways for the GATA6-AS1 knockdown culture on day 2 and day 5. The color keys show the log2 fold changes in gene expression. Pathways upregulated and downregulated in the GATA6-AS1 knockdown culture are shown in red and blue, respectively. Pathways were determined by entering all of the differentially expressed genes found in Panels A and B and inputted into ToppFun. Genes shown in Panel D were selected on their significant p-value to represent the overall log differential of all the genes in the pathway. The average of the log differential of the ten genes represented in Panel D is equal to the average of the log differential of all the genes contributing to the pathway. Genes in Panel E were similarly selected

