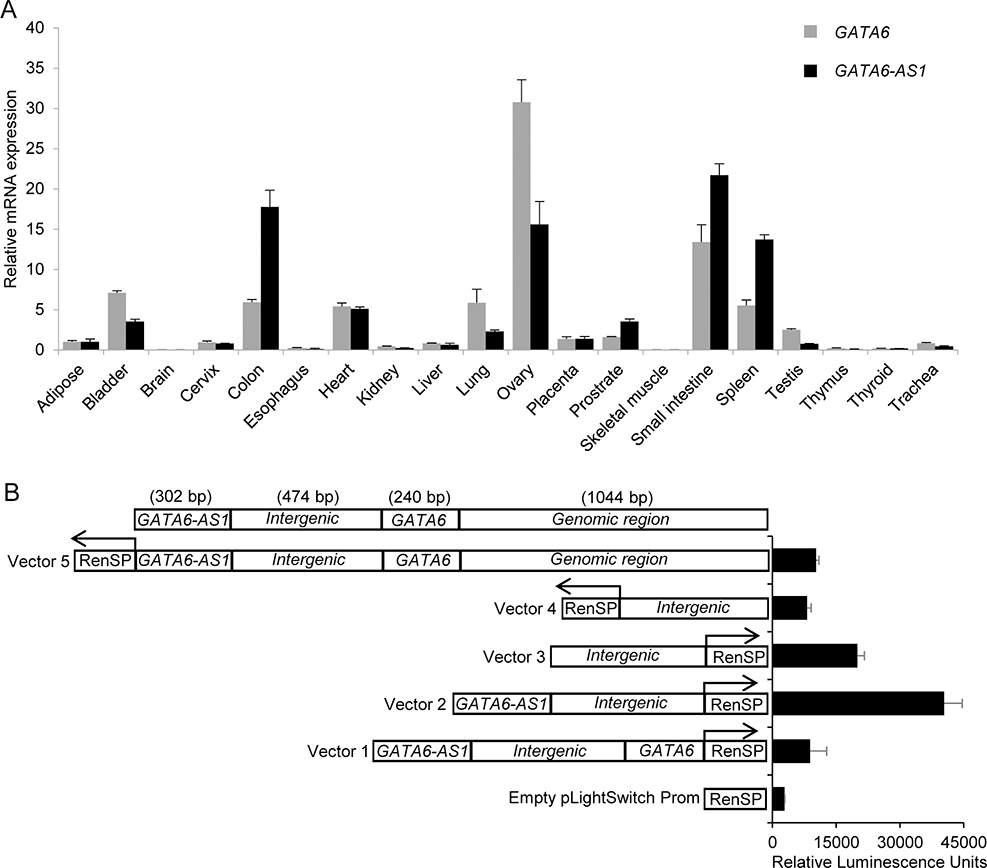
Figure 6. Characterization of GATA6 and GATA6-AS1 expression.
(A) Expression of GATA6 and GATA6-AS1 in multiple human tissues detected by qRT-PCR and normalized by GAPDH expression. The relative mRNA expression levels were normalized to that in adipose tissue. The mean fold difference and standard deviation in gene expression in each tissue were calculated by using three replicates. (B) Detection of promoter activity of the intergenic region. HeLa cells were transiently transfected with vectors with luciferase reporter driven by an inserted sequence containing different combinations of intergenic region with part of the GATA6 and GATA6-AS1 genomic sequence upstream of GATA6 cloned in either the forward or reverse upstream orientation of. The y-axis of the graph represents the relative luciferase activity (RLU), with the transfected constructs shown on the x-axis. The empty pLight switch prom vector represents the luciferase vector lacking a promoter. Arrows indicate the direction of RenSP luciferase reporter gene.

