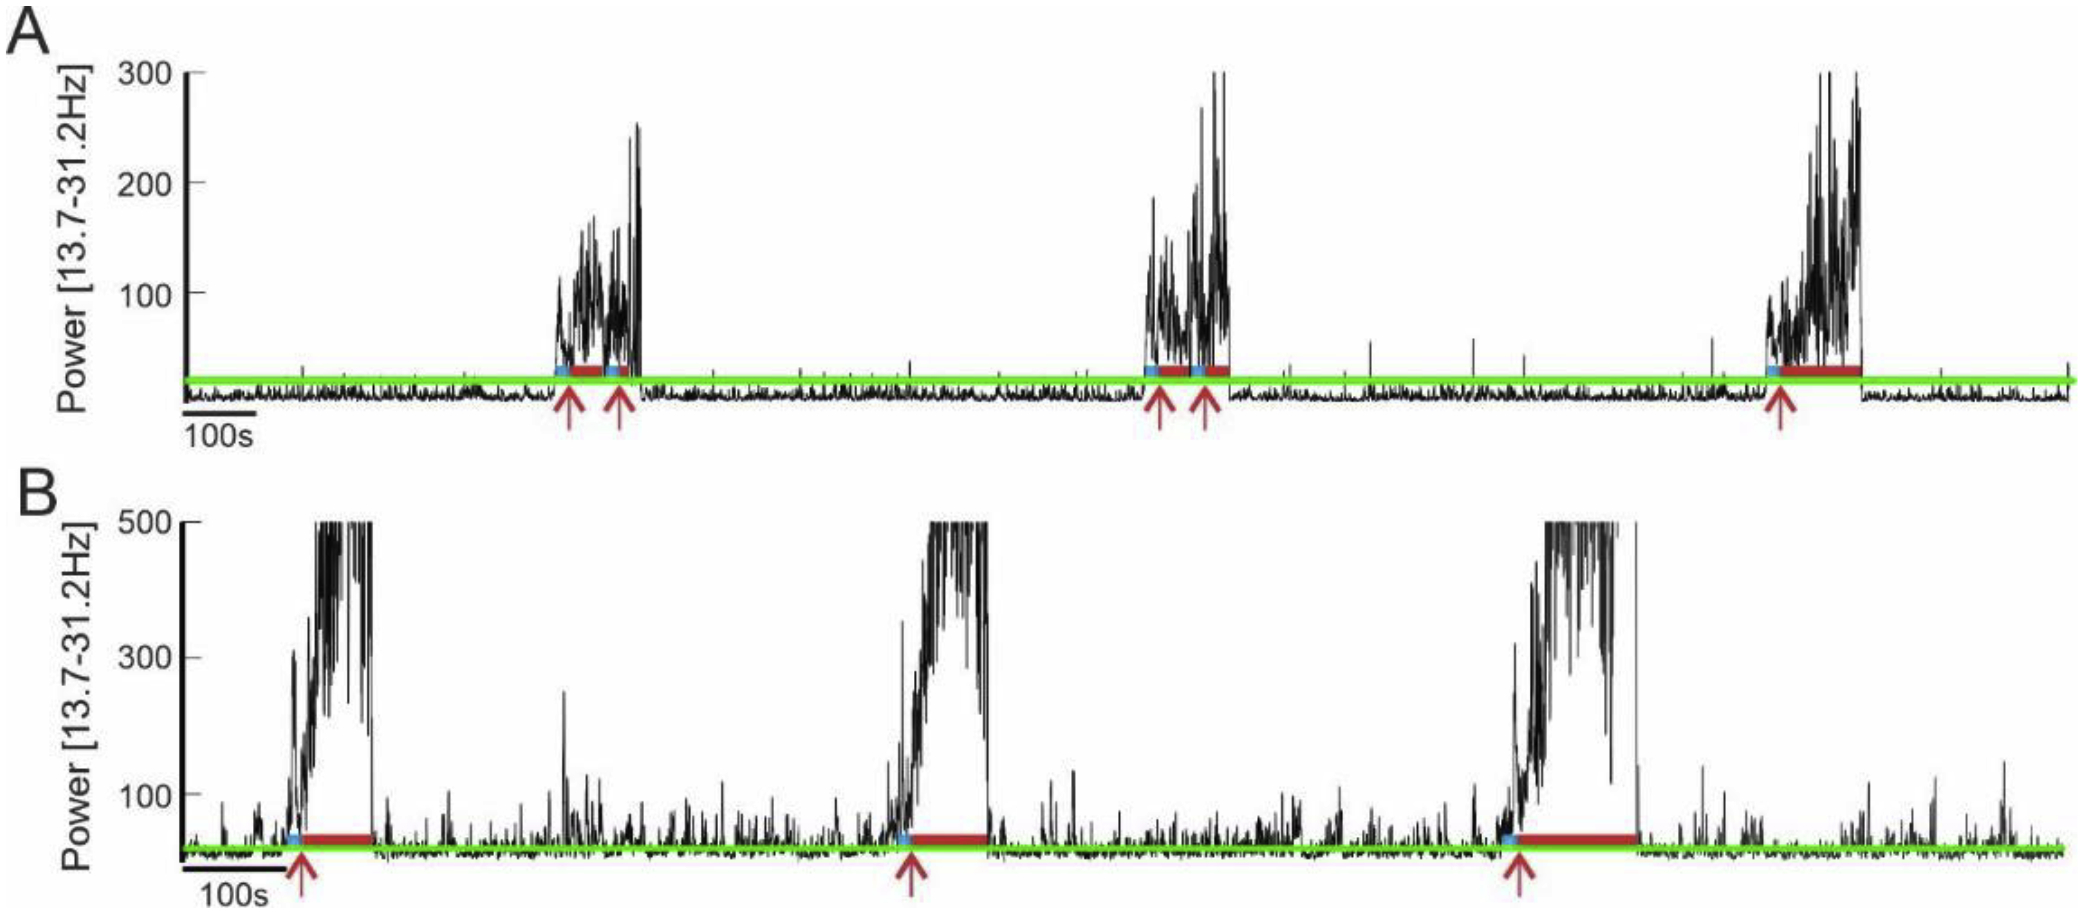
Figure 6.

Alarm triggering based on the power in the [13.7–31.2Hz] band for Monkey A (in A) and Monkey C (in B). The green line corresponds to the power threshold (20db). The blue lines show that the power is above the threshold for 10s, and the red line correspond to the alarm being ON. The red arrows indicate when the email was sent.
