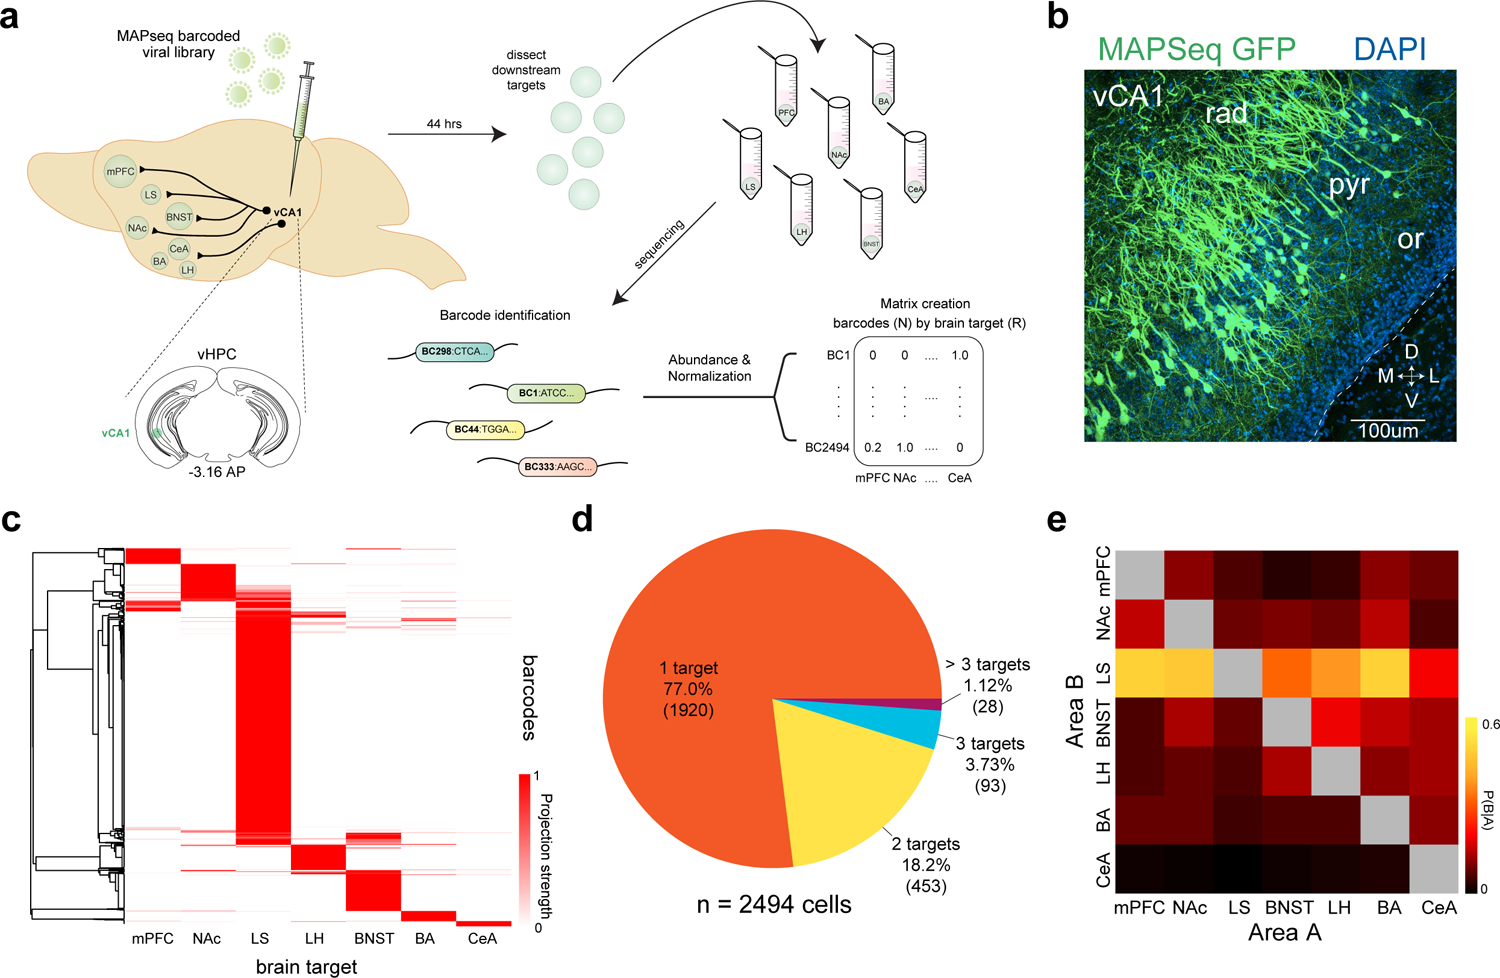
Figure 1. High-throughput mapping of vCA1 projections using MAPseq.

a. Experimental design. We mapped the projections from vCA1 to 7 downstream targets using MAPseq. Briefly, we injected a virus encoding random RNA sequences (barcodes) into vCA1 and allowed them to transport into the axonal processes. Then, we dissected seven known target regions and sequenced the barcodes present to determine which neurons projected to which region. The relative abundance of a barcode present in each area was used as a proxy for the relative projection strength, and an N X R matrix was generated for analysis (N-barcodes, R-brain regions). See Methods for details on each step of the experimental pipeline. b. expression of MAPseq GFP at the injection site in vCA1, representative from n=4 mice. c. Heatmap of projection strengths (from N X R matrix) of all 2494 vCA1 neurons (from 12 mice) to 7 targets mapped with MAPseq. Each row is an individual neuron’s projection strength to each of the 7 target regions, normalized to the maximal value in that row, resulting in a projection strength scale from 0 to 1 (see Methods). d. Distribution of number of projection targets of vCA1 neurons mapped. e. Heat map of conditional probability for two regions (see Methods), the proportion of cells projecting to area B within the subset of cells that project to area A.
