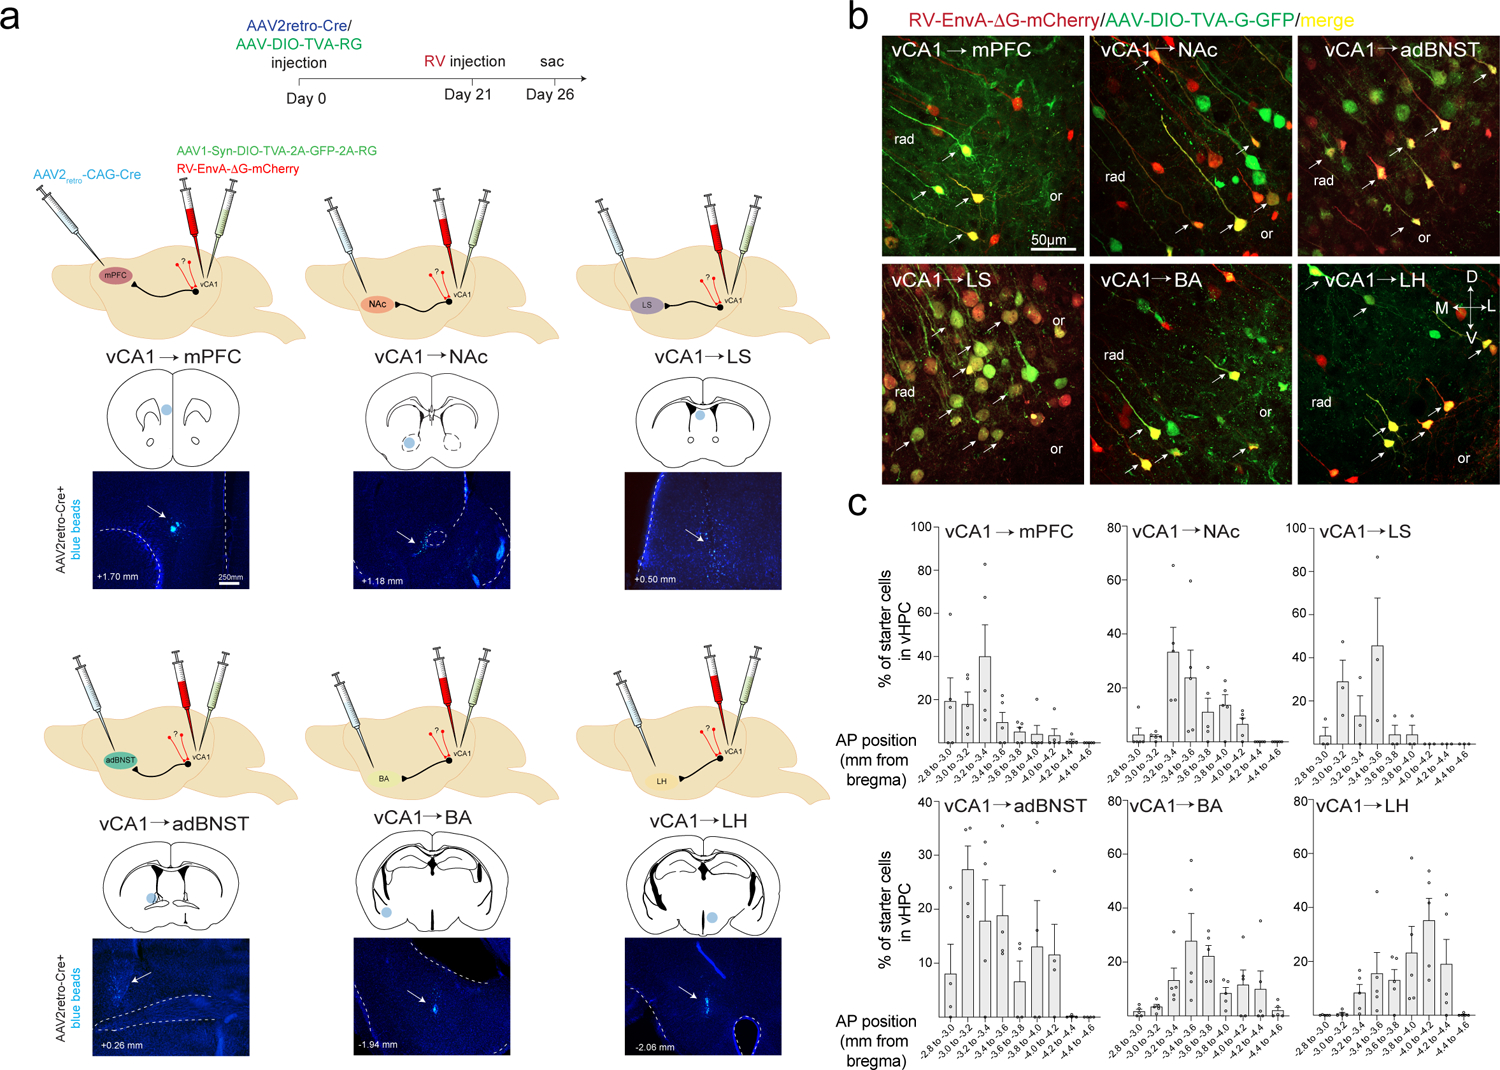
Figure 3. Viral input-output tracing of vCA1.

a. Schematics and timeline for input-output rabies tracing. We targeted six vCA1 outputs, the NAc, LH, BA, mPFC, adBNST and LS with injection of AAV2retro-Cre, (below each brain schematic is the injection sites labeled with blue beads, representative from n= n= 6 vCA1-mPFC, 8 vCA1-NAc, 9 vCA1-LH, 9 vCA1-BA, 4 vCA1-adBNST and 3 vCA1-LS mice,), and injected Cre-dependent rabies helper virus and EnvA-g deleted rabies virus expressing mCherry into vCA1 (see Methods for details). b. Starter cells defined by co-expression of GFP and mCherry in vCA1 in the 6 targeted output populations. Representative from n= 5 vCA1-BLA, 4 vCA1-adBNST, 3 vCA1-LS, 5 vCA1-mPFC, 5 vCA1-NAc and 5 vCA1-LH mice. c. Position of starter neurons counted along the AP axis of the vHPC for each projection population (n= 5 vCA1-BLA, 4 vCA1-adBNST, 3 vCA1-LS, 5 vCA1-mPFC, 5 vCA1-NAc and 5 vCA1-LH mice. Error bars represent SEM).
